New Human Physiology | Paulev-Zubieta 2nd Edition
Chapter 14: Gas Exchange and Disorders
| HOME | PREFACE | TABLE OF CONTENTS | SYMBOLS | SECTION INFO | CONTRIBUTORS | LINKS | CONTACT US |
Highlights
Study_ObjectivesPrinciplesDefinitionsEssentials
PathophysiologyEquationsSelf-AssessmentAnswers
Further Reading
|
Chapter 14
|
 |
|||||||||||||||||||||||||||||||||||||||||||||||||||||||||||||||||||||||||
|
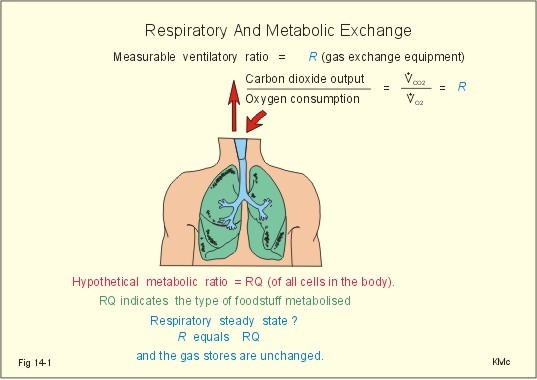
· To define cardiac output, diffusion, diffusion- and perfusion-limited gas exchange, hypercapnia, hypocapnia, hypoxia, respiratory quotient (RQ), ventilatory exchange ratio(R) , and the ventilation-perfusion ratio (V°A / Q° -ratio) . · To describe Henry’s and Dalton’s laws, factors of importance for the lung diffusion capacity and pulmonary perfusion, and its measurements, describe the PO2-PCO2-diagram, hypo-and hyperventilation, pulmonary water balance, and mixed venous blood composition. · To calculate the pulmonary perfusion, use the alveolar gas equation, the alveolar ventilation equation, the final V°A / Q° -equation, and the law of mass balance in calculations. · To explain the alveolar oxygen uptake and carbon dioxide output, pulmonary vascular resistance and pressures. To explain the alveolar dead space, veno-arterial shunts, uneven regional ventilation-perfusion ratio in health and disease, and peripheral gas exchange. · To use the concepts in problem solving and case histories. · Bernoulli’s principle or equations (see Eq. 13-6). · Alveolar oxygen uptake per min is the uptake of oxygen molecules into the passing pulmonary blood - into the cardiac output. · Cardiac output is the volume of blood leaving the left (or the right) ventricle each min. · Diffusion is a transport of atoms or molecules caused by their random thermal motion. · Diffusion capacity for the lung (DL ) is defined as the volume of gas diffusing through the lung barrier per min and per unit of pressure gradient (DL = V°O2/ DP). · Diffusion-limitation of gas exchange is a condition where equilibration does not occur between the gas tension in the pulmonary capillaries and the alveolar lumen. When the distance between the capillary blood and the cells is large, diffusion becomes a limiting factor even at high bloodflow. · Hypercapnia refers to a resting condition with hypoventilation, where PaCO2 is higher than 6.4 kPa (48 mmHg). · Hypocapnia is a hyperventilation disorder with abnormally reduced PaCO2 at rest (below 33 mmHg or 4.4 kPa). · Hypoxia denotes oxygen deficiency in tissues due to insufficient delivery of oxygen or inability to utilize oxygen. Hypoxia may be present both with low PaO2 and with normal PaO2. · Hypotonic or hypobaric hypoxia is characterised by a PaO2 less than 7.3 kPa (55 mmHg). This is the threshold, below which the ventilation starts to increase by carotid body stimulation. As the altitude increases, the barometric pressure decreases and the partial pressure of oxygen in the alveolar air falls. · Hypoxic pulmonary vasoconstriction is a compensatory mechanism in alveoli with low ventilation and low oxygen partial pressure. The mechanism is triggered directly by smooth muscle contraction in the vessel walls at a PaO2 less than 7.3 kPa (55 mmHg). · Multiple inert gas technique is a procedure, where multiple inert gases of different air—to-blood solubility ratios are infused intravenously until steady state of pulmonary gas elimination is reached. The partial pressure of each gas is measured inthe infused fluid and in the expired air. The V°A / Q° -equation (Eq. 14-5) and the law of mass balance is used to compute the most likely regional V°A / Q° -distribution. - Clinically, the alveolar-arterial oxygen tension gradient is measured instead of this complicated reseach procedure. · Perfusion-limited or flow-limited gas exchange is limited by the bloodflow. The only limitation to net movement of small molecules across the capillary wall is the rate at which bloodflow transports the molecules to the capillaries. · Peripheral Resistance Unit (PRU) is measured as driving pressure per bloodflow unit (eg, mmHg*s*ml-1). · Pulmonary hypertension is a condition with a mean pulmonary artery pressure above normal - a pressure above 2 kPa or 15 mmHg. · Pulmonary vascular resistance (PVR) is the ratio between the pressure gradient and the bloodflow. The basic equation is: PVR (PRU) = DP / bloodflow (PRU in mmHg*s*ml-1). · Pulmonary oedema is an emergency caused by filtration of fluid out of the pulmonary capillaries into the interstitial space (interstitial oedema), and eventually in the alveolar spaces (alveolar oedema). · Respiratory Quotient (RQ) is a metabolic ratio between the carbon dioxide output and the oxygen uptake of all cells of the body. · Standard affinity is the binding force between two molecules, when half of the binding sites are occupied (at 50% saturation). In the case of oxyhaemoglobin the P50 is used. Here, standard affinity is equal to 1/P50. · Ventilatory exchange ratio (R) is the ratio between the carbon dioxide output and the oxygen uptake measurable with gas exchange equipment at the mouth. This paragraph deals with 1. Gas exchange, 2. A key to lung disorders, 3. Uneven distribution of tidal volume and perfusion, 4. Blood gases, 5. The PO2 - PCO2 diagram, 6. The V°A / Q° - curve, 7. Blood-R-curves, 8. Dead space, 9. Anatomic venous-to-arterial shunt, 10. Ficks law of diffusion, 11. Single -breath diffusing capacity, 12. Compensation of V°A /Q ° - mismatch, 13. Pulmonary bloodflow, and 14. Regional ventilation. gases are exchanged between the atmosphere and the alveolar air, and gases diffuse between the alveolar air and the blood flowing through the pulmonary capillaries. Oxygen is transported from the atmosphere, via the alveolar ventilation and then carried by the pulmonary bloodflow (equal to the cardiac output), into the cells and their mitochondria for metabolic purposes. Carbon dioxide, the final end-product of metabolism, migrates from the cells to the atmosphere. A healthy normal person at rest, ventilates his lungs with 5 litres (l) min-1 of fresh air (V°A). The Respiratory Quotient (RQ) is a metabolic ratio between the carbon dioxide output (V°CO2) and the oxygen uptake (V°O2) defined for all body cells as a whole. In respiratory steady state, RQ can be measured as the ventilatory exchange ratio (R) (Fig. 14-1). On a diet dominated by carbohydrate the metabolic RQ for all cells of the body is approaching 1, and in a respiratory steady state, identical to the ventilatory exchange ratio, R, which is measured in the expired air (Fig. 14-1).
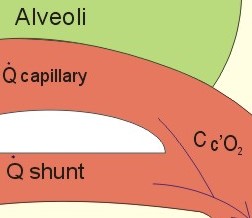
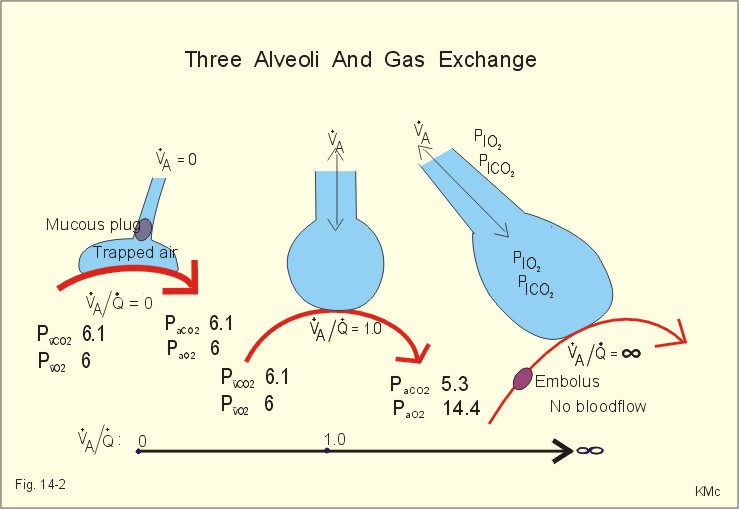
Fig. 14-1: The respiratory quotient (RQ) is compared to the measurable ventilatory exchange ratio (R). The normal resting carbon dioxide output is 10 mmol or 224 ml STPD per min from an adult person, and the cardiac output is typically 5 l min-1. The blood volume of 5 l carries each min about 10 mmol (or 224 ml STPD) of oxygen towards the mitochondria. Following passage of the capillary system, the same amount of CO2 is carried towards the lungs in the venous blood as long as RQ and R is 1. Blood passing the pulmonary capillaries of a healthy person is rapidly equilibrating with the alveolar air. Oxygen from the air diffuses into the blood and binds reversibly with haemoglobin. The normal oxygen capacity is 200 ml STPD per l of blood (150 g haemoglobin per l carrying 1.34 ml STPD per g). The six zones of the alveolar-capillary barrier are: 1) a fluid layer containing surfactant, 2) the alveolar epithelium; 3) a fluid-filled interstitial space ; 4) the capillary endothelium with basement membrane; 5) the blood plasma; and 6) the erythrocyte membrane. The six zones form an almost ideal gas exchanger for oxygen and carbon dioxide diffusion. There are 300 million tiny blind end sacs (alveoli) in both lungs together. Fortunately, the alveoli are diluted continuously with fresh air as we breathe. The alveolar ventilation-perfusion ratio is presented as a straight line in Fig. 14-2. Alveolar ventilation (V°A ) and pulmonary bloodflow (equal to the cardiac output, Q°) is considered in three extreme situations: 1. The normal condition in which V°A and Q° are matched ( ideal V°A / Q° -ratio = 5/5 = 1), is shown with the typical normal arterial gas tensions (Fig. 14-2). 2. Pulmonary embolism creates an alveolar dead space. The V°A is maintained, but there is no bloodflow (Q° regional), so the V°A / Q° -ratio of the lung region approaches infinity. In the alveolar dead space, alveolar gas pressures approach the levels in inspired air. 3. Occlusion of the airway represents an extreme mismatch of venous to arterial shunting of blood, namely perfusion with no ventilation at all (ie, the total ratio approaches zero). The arterial blood gas tensions approach those of venous blood (Fig. 14-2). The straight line (or V°A / Q° -axis) of Fig. 14-2 represents an infinite row of ventilation-perfusion-values. Each value refers to an alveolus with equilibrated blood flowing by. Two well-known equations are relevant here: the Fick cardiac output equation (Eq. 14-1) and the alveolar gas equation (Eq. 14-3). The hyperbolic relationship between V°A and FACO2 is described in the alveolar ventilation equation (Eq 14-4). These three equations can be combined to one equation, which can be expressed in several ways. The calculations are not shown here. The final equation reads as Eq. 14-5: V°A / Q° = R( CaO2 - Cv¯CO2) / FACO2 Solutions of this equation provide values from zero to infinity for the ventilation-perfusion-ratio. These solutions can be plotted in a PO2 - PCO2 diagram (Fig. 14-6), where complicated calculations are performed and solved graphically at a glance by looking at the red V°A / Q° --curve. In the venous point the V°A / Q° -ratio is zero, and in the I-point on the abscissae the V°A / Q° -ratio is infinite. The regional V°A / Q° -ratio is the all-important variable. In any cardio-pulmonary disease, the normal variation of the ratio for the entire system (Fig. 14-2) is exagerated.
Fig. 14-2: Three pulmonary regions or alveoli representing 3 V°A / Q° ratios from zero to infinity. Normally, the ventilation/perfusion-ratio is 0.8-1.2 for the entire system. Blood gas tensions are given in kPa (133.3 Pa equals 1 mmHg). 3. Uneven distribution of tidal volume and perfusion can eventuate from uneven resistance to airflow within the lung (bronchoconstriction, collapse and compression of airways). Uneven distribution can also be caused by uneven regional lung compliance (insufficient surfactant, loss of elastic recoil as in destruction of alveolar tissue, and increase of elastic recoil as in connective tissue scarring or fibrosis with stiff lungs). Hypoperfusion can be caused by compression of pulmonary vessels, obliteration of vessels by fibrosis, or blockage by emboli or thrombosis. Functional shunts arise with any consolidation of alveolar regions that continue to have bloodflow (pneumonia, oedema, haemorrhage, cell necrosis, lack of surfactant). Blood gases from an arterial blood sample of a healthy person typically show the values of Table 14-1:
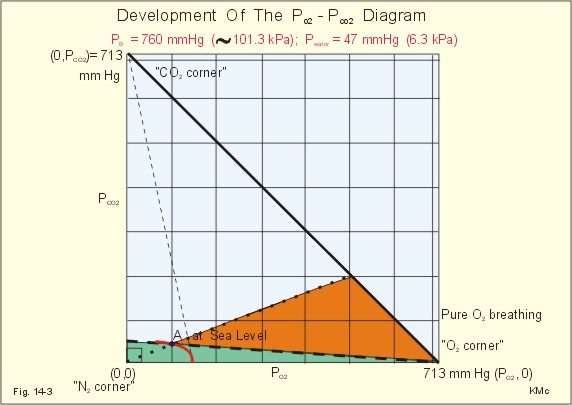
The blood gases are essential in the management of severely ill persons with respiratory or circulatory diseases. Any patient - as any healthy person - has some degree of ventilation-perfusion mismatch. The PaO2 in itself is a good detector of consequential mismatch, but skilled management necessitates interpretation of PO2 -PCO2 combinations. This is quite easy with the use of Fenn & Rahn´s PO2 - PCO2 diagram. Let us develop this excellent clinical tool from simple mathematics and geometry. 5. The PO2 - PCO2 diagram (Fenn-Rahn) The general PO2 - PCO2 - diagram is actually a rectangular triangle with the following corners: (0,0), (PO2 , 0) and (0, PCO2 ) in Fig. 14-3. The total tension of all three dry gases is equal to (PO2 + PCO2 +PN2) or the barometric pressure (PB) minus the tension of water vapour in the alveolar air at 37o C. The total dry tension at PB=760 mmHg is thus (760 - 47) = 713 mmHg or (101.3 - 6.3) = 95 kPa. Accordingly, the 713 mmHg on the abscissa refers to pure oxygen (O2), the 713 on the ordinate refers to pure carbon dioxide (CO2), and (0,0) represents pure nitrogen (N2). Let us assume that analysis of an alveolar air sample results in values shown in point A of the diagram. The diagonal is the hypotenuse of the triangle with a slope of –1. The vertical or the horizontal distance to the diagonal gives the size of the PN2, so in each point all three tensions can be read. Maintained breathing of pure oxygen leaves all possible expiratory values on the diagonal of Fig. 14-3, namely -1, which is an R-value of 1. In any event, R is always equal to one, when one mole of CO2 is given off to the alveolar air for each mole of O2 uptake by the blood (Fig. 14-3 and 14-4).
Fig. 14-3: The general PO2 - PCO2 diagram as developed by Fenn and Rahn. The two axes show the total partial pressure sum of the three dry gases at one atmosphere. A is a representative alveolar point when breathing air. - Typical alveolar points in the Andes and on the top of Mt. Everest are also shown. – The total dry tension is 713 mmHg or 95 kPa. Maintained breathing of atmospheric air at sea level implies a PIO2 around 150 mmHg (Fig. 14-3). A line from this point to the “CO2 corner “ of Fig. 14-3 represents the situation, where the venous blood delivers CO2 to the alveolar air without uptake of O2. Accordingly, V°O2/ V°CO2 approach infinity and thus R approaches infinity.
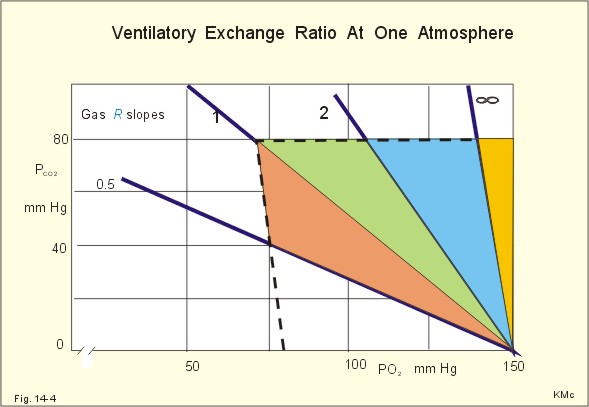
Fig. 14-4: The ventilatory exchange ratio, R, in different lung regions when breathing air at one atmosphere of pressure (modified from Fenn-Rahn). When only O2 is given off to the blood and no CO2 is removed, the R- line falls on the abscissa (Fig. 14-4). All possible R-values are easily constructed graphically from any PB on the PO2 - PCO2 diagram. The gas-R lines fan from the inspiratory or I -point (Fig. 14-4). All alveolar ventilation-perfusion ratios (V°A / Q° -ratio) from zero to infinity were represented by the straight line of Fig. 14-2. This line covers all possible combinations of regional ventilation-perfusion-units in the lungs in health and disease. This line can be changed to a curve by transfer to the PO2 - PCO2 diagram (Fig. 14-5). Such a curve connects the points for the regional V°A /Q° -ratio equal to zero (v¯ with all perfusion-no ventilation) and for the regional V°A /Q° -ratio equal to infinity (the inspired point I with no perfusion-only ventilation). Alveolar tensions around A refer to the healthy upright lung, where the regional V°A /Q° -ratio is slightly less than one in most alveolar units. Normally, alveolar ventilation (V°A) and perfusion (Q°°) are matched and the total V°A /Q°° -ratio is between 0.8 to 1.2 with normal alveolar and blood gas tensions. In the normal upright lung the regional V°A /Q°° -ratio is approximately 0.6 at the lower and about 3 at the upper lung region.
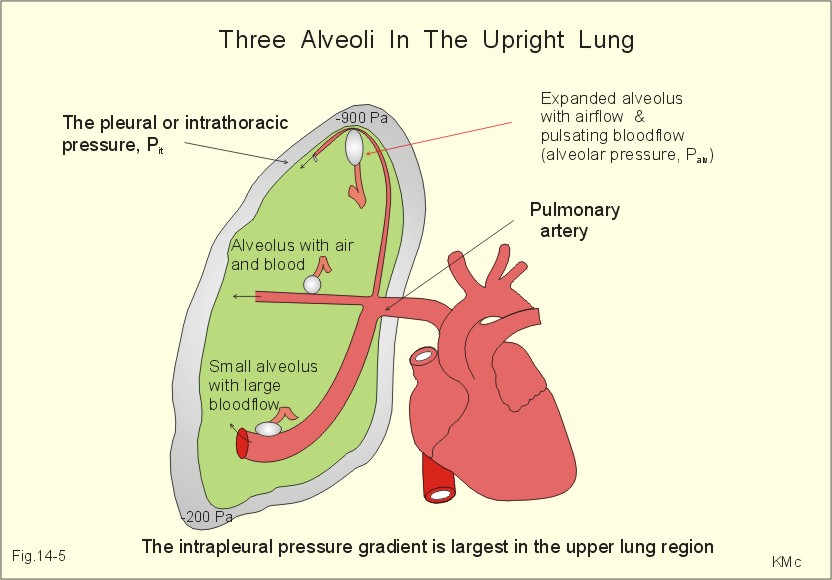
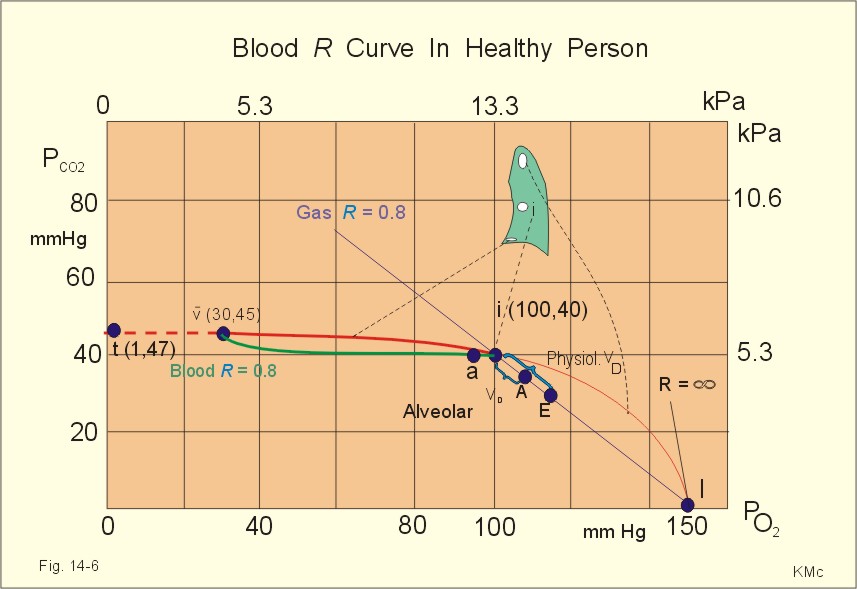
Fig. 14-5: Three alveolar regions in the upright lung of a healthy person at rest. The upper alveolus and airway is distended and its bloodflow is minimal. The lower alveolus is compressed by gravity and its bloodflow is high. The pulmonary bloodflow decreases from the lower to the upper parts of the lung of a resting person (Fig. 14-5). Likewise, the relative ventilation of the lung also decreases linearly from the base to the apex, but at a slower rate. Thus, the regional ventilation-perfusion ratio varies from zero in the lower region, where there is only bloodflow and no ventilation to infinity in the upper region, where there is only ventilation and no bloodflow. At the lower lung region, regional V° approaches zero and at the top of the lung regional perfusion approaches zero. In a PO2 - PCO2 diagram each point on the curve represents partial pressures at which alveolar air and blood can equilibrate at a certain V°A / Q° -ratio. Thus for any practically obtainable point, a single value exists for blood gas concentrations (see later in Fig. 14-6). - Lung regions at the base with low V°A /Q°° has low PAO2 and high PACO2, relative to normal mean values. Upper lung regions with high V°A /Q°° have relatively high PAO2 and low PACO2. For a person in respiratory steady state, the R- value of the blood is equal to the R -value of the alveolar gas (the gas-R). As respiratory gases are exchanged with a certain R- value (eg, R=1), the passing blood must do the same. Accordingly, the blood-R is equal to the gas-R. The blood -R curves fan out from the venous point (Fig. 14-6). One green blood-R curve is shown. The green curve intersects with its blue gas- R-line on the V°A /Q° - curve. The shape of the blood-R curves is dictated by the oxyhaemoglobin dissociation and the carbon dioxide binding curves, which in turn are affected by the Bohr- and the Haldane-shifts.
Fig. 14-6: Gas-R and the related blood-R curve (0.8) drawn together with the V°A /Q° - curve. An ideal alveolar point is shown (i) together with normal values for arterial (a), alveolar (A), and expired (E) gas tensions. - The symbol t for tissue (co-ordinates 1,47 mmHg) denotes minimal tensions in the peripheral tissues of a healthy person. The regional V°A /Q° -ratios (Fig. 14-6) show the lower lung regions to be relatively underventilated (ratio below one), the middle lung regions to be well matched (ideal regional ratio of 1), and the upper lung regions to be relatively overventilated (ratio above 1 and approaching infinity). Also R approach infinity when we approach the inspired point I, Fig. 14-6). Points A and E refer to the alveolar and expired air tensions, respectively. Every regional deviation from the average total V°A / Q° -ratio of 1 in healthy subjects, will result in alveolo-arterial gas tension differences (see later in Fig. 14-6). Underventilated and overperfused alveoli have increased PAN2 and thus increased PaN2 , whereas overventilated alveoli reduce their PACO2 almost as much as they increase PAO2 . Hereby, PaN2 becomes greater than PAN2 , and a precisely measured difference is used as a measure of mismatch. Ideal lungs have a matched ventilation-perfusion ratio resulting in an ideal composition of the alveolar air throughout the lung. With all alveoli having identical V°A / Q° -ratio s, the alveolar point A would be located in the ideal point i for all alveoli (see Fig. 14-7). Doubling of alveolar ventilation will move the point A halfway down the blue diagonal towards I, and as alveolar ventilation approaches infinity the gas concentrations of the alveolar air approaches those of the inspired air (I). Normally, the expired air values are always represented by a point E on the diagonal between A and I (Fig. 14-6). All the displacement from ideal point i to real life point A is caused by alveolar dead space, and all the displacement from i to E is caused by alveolar plus anatomic dead space. This sum is also termed the physiological dead space (Fig. 14-7). The physiological dead space of a healthy adult at rest is approximately 150 ml out of a tidal volume of 500 ml (30%). During exercise the physiological dead space will rise to perhaps 200 ml simultaneously with a rise in tidal volume to 2000 ml as an example. This is a relative physiological dead space of only 10%, which is an advantage to the individual during work.
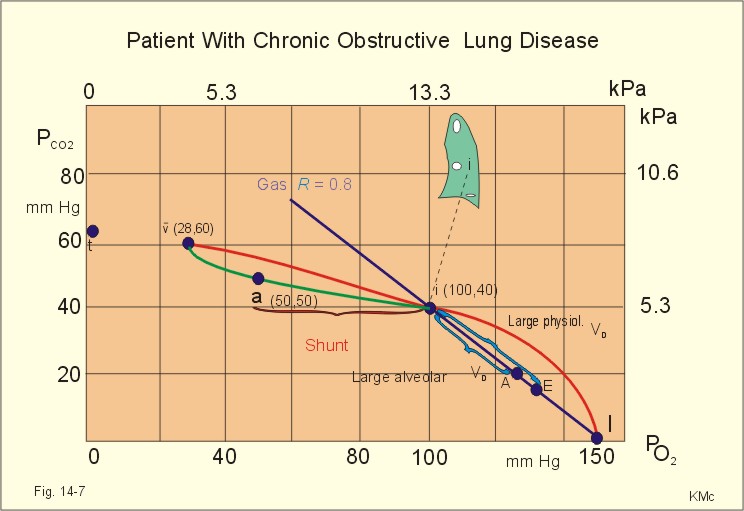
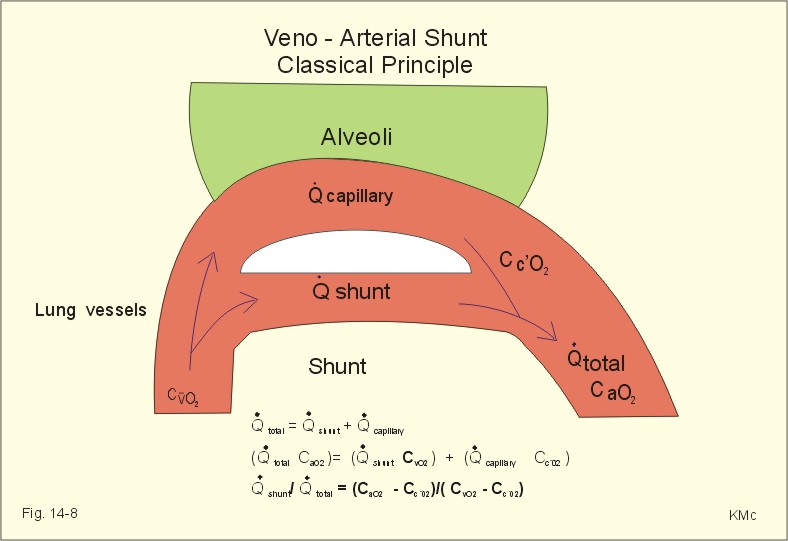
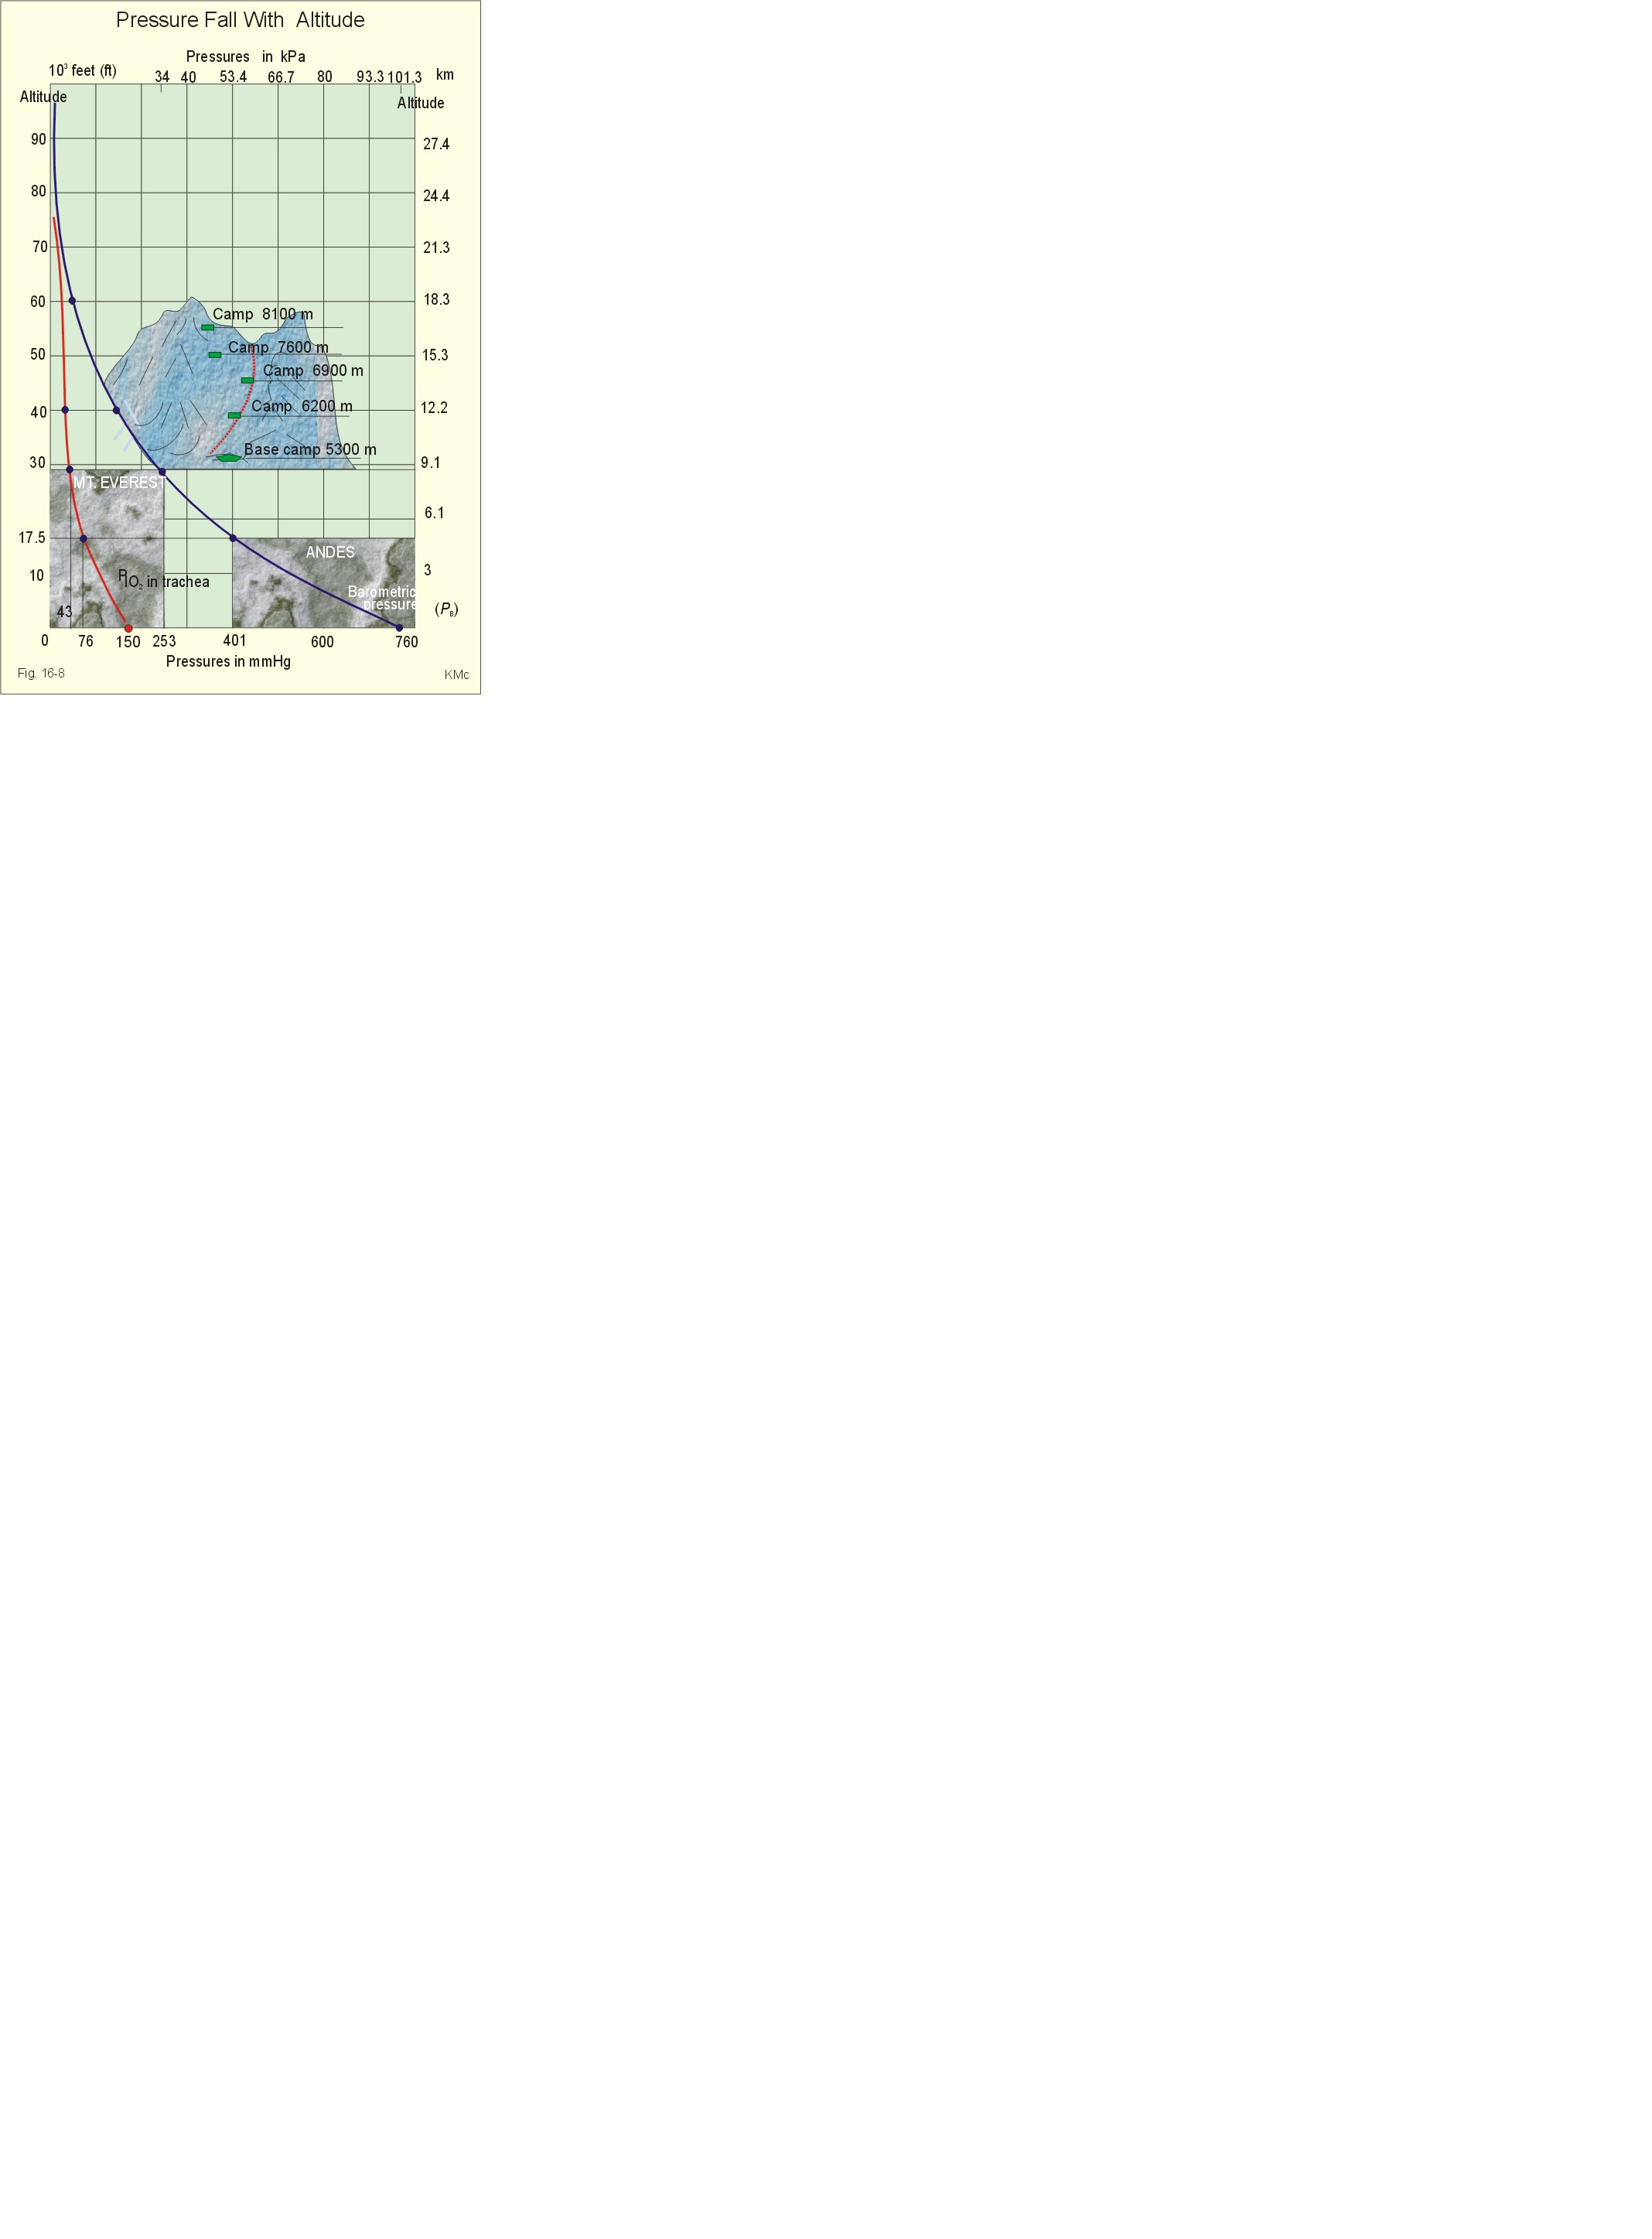
Fig. 14-7: Alveolar (A), expired (E) and arterial (a) gas tensions from a patient with chronic obstructive lung disease. Both a large alveolar dead space and a serious shunt are present. The ideal point (i) is also shown. The different locations of the symbol’s t illustrate the tensions in peripheral tissues of a patient and of a healthy person. In healthy persons, the alveolar gas tensions vary during a respiratory cycle around a mean value, although the oscillations are close to the ideal point. These variations are called alveolar gas tension oscillations (see Chapter 16, Fig. 16-8). Patients with lung disorders often have V°A /Q°° -mismatch by a combination of areas of veno-arterial shunting often in the lower lung regions, and areas of increased alveolar dead space often in the upper lung regions (Fig. 14-7). The location of the arterial point a (50,40 mmHg) on the green curve indicates that the i-a distance is larger than 50% of the total i-v distance, which must be caused by more than 50% veno-arterial shunting. This i-a distance is an essential clinical concept, called the ideal alveolar-arterial PO2 gradient (Fig.14-7). The closer point a is to point v¯, the larger is the shunt. The veno-arterial shunt is total (100%), when the point a is moved to the point v¯ 9. Anatomic venous-to-arterial shunts Normally, up to 5% of the venous return passes directly into the systemic arterial circulation. This shunt-blood includes nutrient bloodflow coming from the upper airways and collected by the bronchial veins. Also the coronary venous blood that drains directly into the left ventricle through the Thebesian veins is shunt-blood. The classical way to determine the relative size of a shunt is by the law of conservation of matter. Adolph Fick used the naturally occurring indicator oxygen as substance (Fig. 14 -8). The law of mass balance is applied to both bloodflow and oxygen flux in Eq. 14 -7 and 14-8, where Cc´02 is the oxygen concentration in the pulmonary end capillary blood of an ideally functioning alveolus (Fig.14-8). The flow and flux relations lead to Eq. 14-9, which shows that the classical method, necessitates cardiac catheterisation to get mixed venous blood (Cv¯O2) for the determination of mixed venous gas tensions.
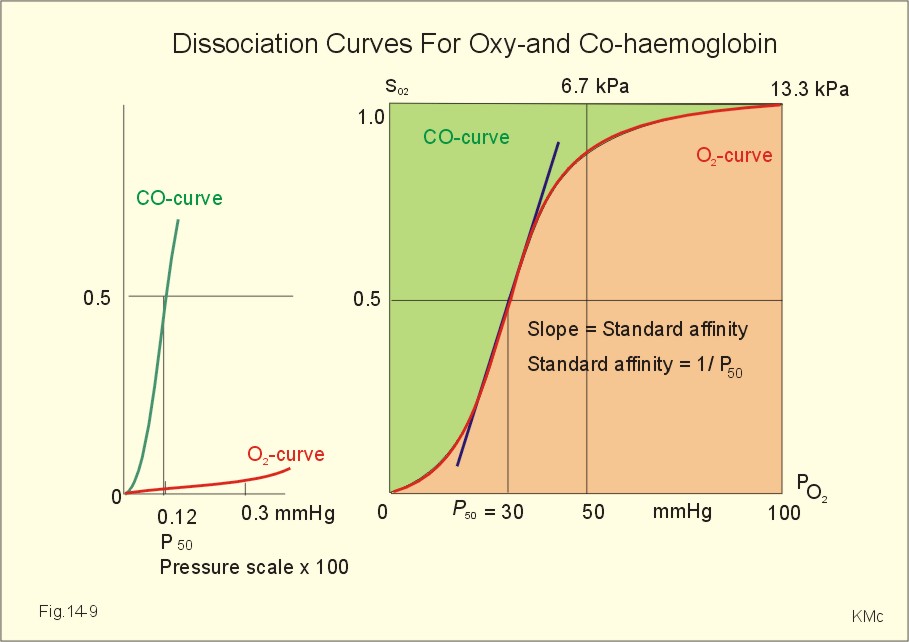
Fig. 14-8: The classical method of determining the size of a shunt implies cardiac catheterisation and measurements of blood gas concentrations. The location of point E, more than half way down the diagonal to I, suggests a large physiological dead space - more than 50% of the tidal volume (Fig. 14-7). As the disease progresses, the venous point (v¯) moves to the left and upward, so that peripheral tissues with the smallest PO2 gradient become increasingly hypoxic. The broken curve shows the tensions in tissues from the mixed venous driving tension to tissue tensions (t) of only one mm Hg (Fig. 14-7). The slopes of these tissue tension curves are about 1/20, reflecting that CO2 diffuses 20 times faster than oxygen (23.2 * 0.85= 20). In the final phase of lung disorders also hypercapnia becomes prominent (see the venous point with high PCO2 in Fig. 14-7). states that the flux of gas transferred across the alveolar-capillary barrier is related to the solubility of the gas, the diffusion area (A), the length of the diffusion pathway from the alveoli to the blood (L), and the driving pressure (P1 - P2). These factors are all included in the simplified version of Ficks law marked Eq. 14-2. The solubility is also called the Bunsen solubility quotient, a. Although the diffusion area at rest is close to the size of half a tennis court, and the diffusion distance (L) is 0.5 - 1 micrometer, it is difficult to predict their variations between individuals. Therefore, Marie Krogh developed the individual lung diffusion capacity (DL) defined as the flux of gas transferred per pressure unit through the lung barrier of a certain person. Since the counter pressure of CO in the blood is virtually zero, a simple measure of PACO provides us with the pressure gradient in Eq. 14-2. The standard affinity of the haemoglobin-CO reaction is very large and 250 times greater than that of O2 (Eq. 14-10). The standard affinity is measured as the reciprocal value of P50. The P50 for haemoglobin-CO is just a fraction of one mmHg, and the haemoglobin-CO dissociation curve is too close to the ordinate of Fig. 14-9 to show - so an enlargement is drawn to the left. - DL consists of a barrier-factor (consequential in lung oedema and in lung fibrosis) and a haemoglobin-factor (which reflects the binding rate of oxygen to haemoglobin). The presence of haemoglobin permits blood to absorb 65-fold as much O2 as the content in plasma at normal PaO2.
Fig. 14-9: Dissociation curves for Oxy- and CO-haemoglobin. CO competes with O2 for binding sites on haemoglobin, and thus exposure to CO reduces the O2 binding to haemoglobin. Persons breathing traces of CO occupy a large fraction of all binding sites by CO. The CO binding causes a leftward shift of the oxy-haemoglobin dissociation curve. All the binding sites that are bound to CO, do not respond to falling PaO2. The remaining O2 molecules on the CO-haemoglobin molecule are much more avidly bound and unload slower than normal. Diffusion is rapid over short distances. In normal lungs there are trans-barrier pressure gradients for diffusion of both O2 and CO2. DLCO is measured by measuring the carbon monoxide uptake and the driving pressure (see single-breath diffusing capacity below). 11. Single-breath diffusing capacity The subject takes a deep breath of 0.3% carbon monoxide (CO) and holds the breath for 10 s before exhaling and alveolar sampling. During the breath holding, CO is taken up by the haemoglobin of the passing blood in proportion to its alveolar tension (PACO). A simple assumption is that the CO uptake is directly proportional to the mean alveolar PCO (symbolised with PACO). The diffusing capacity of the lung (DL) is also called the transfer factor, because DL measures not only diffusion, but the barrier thickness and ventilation-perfusion mismatch as well. Patients with lung disease often have abnormal size and thickness of the alveolar barrier or ventilation-perfusion mismatch. In such cases measurement of the CO transfer need not be a true measure of the total diffusing capacity.
The single-breath CO diffusing capacity is normally 3 ml STPD s-1 kPa-1 at rest. The values during rest and exercise - and in two units - are shown in Table 14-2. The transfer factor is reduced by diseases affecting the lung parenchyma, such as emphysema, pneumonectomy and fibrotic diseases (the alveolar barrier is too small in area or too thick or both). 12. Compensation of V°A /Q°- mismatch Low PAO2 in poorly ventilated alveoli, causes arteriolar constriction, which redistributes bloodflow to well-ventilated alveoli. Low PACO2 exists in alveolar regions with a high ventilation-perfusion-ratio. Low values constrict the small airways leading to these alveoli. Their reduced ventilation results in redistribution of gas to alveoli with better bloodflow. Pulmonary vascular resistance (PVR) is minimal compared to that of the systemic circulation. The pulmonary vascular system is basically a low-pressure, low-resistance, highly compliant vessel system with a bloodflow sensitive to gravity and to PAO2. The system is meant to accommodate the entire cardiac output - and not to meet special metabolic demands as in the case of the systemic circulation.
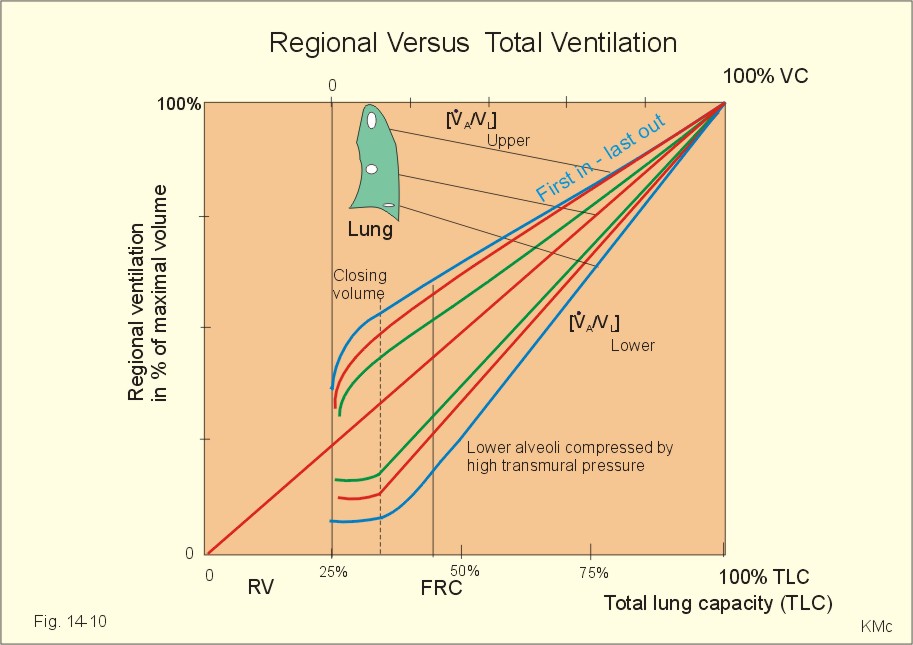
The pressure in the right ventricle is 3.3 kPa systolic and - 0.133 kPa diastolic in a healthy, supine person at rest. The pressure in the pulmonary artery is about 3.3 kPa systolic and 1 kPa diastolic, with a mean of 1.7 kPa (Table 14-3). The blood flow of the pulmonary capillaries pulsates and its mean pressure is below 1 kPa. The pressure in the left atrium is 0.7 kPa. This value implies a pressure drop across the pulmonary circulation of (1.7 - 0.7) = 1 kPa. This driving pressure is less than 1/10 of the systemic driving pressure. The walls of the pulmonary vessels are thin, hence their pressure must fall at each inspiration, because the intrapulmonic pressure falls. Change of posture from supine to erect position, will reduce the pressure toward zero in the apical vessels, whereas it increases the pressure in the basal vessels due to gravity. When the driving pressure in the apical blood vessels approaches zero, the blood flow will also approach zero. Apart from its implication for gas exchange, this phenomenon limits the supply of nutrients. Lung disorders often occur in the apical regions. The pulmonary vascular resistance (PVR) is the ratio between the pressure gradient and the bloodflow. A peripheral resistance unit (PRU) is measured as driving pressure per bloodflow unit. The basic equation is: PVR (PRU) = DP/bloodflow (mmHg*s*ml-1). At rest, the pulmonary driving pressure is 8 mmHg (Table 14-3), and the bloodflow is 5 l per min (83 ml per s). The ratio is 8/80 = 1/10 PRU (normal PVR is only 10% of the systemic resistance at rest: TPVR = 1 PRU). Calculated in kPa the PVR is 1/80 kPa s ml-1. Such low values for PVR are only found in the lungs of healthy, non-smokers. The PVR remains low in healthy persons, even when cardiac output increases to 30 l per min, because of distensibility and recruitment of pulmonary vessels. Stretch receptors, found in the left atrium and in the walls of the inlet veins, are believed to be stimulated by distension. Such a distension blocks liberation of vasopressin (antidiuretic hormone, ADH) from the posterior pituitary and releases atrial natriuretic factor (ANF) from the atrial tissue. Hereby, the urine volume increases and the extracellular volume decreases. Changes in pulmonary vascular resistance are achieved mainly by passive factors, but also by active modification. Passive factors: The larger arteries and veins are located outside the alveoli (extra-alveolar); they are tethered to the elastic lung parenchyma, and are exposed to the pleural pressure. The pulmonary capillaries lie between the alveoli and are exposed to the alveolar pressure. Alveolar capillary volume. The intra-alveolar vessels are wide open at low alveolar volumes, so that their PVR must be minimal. With increasing alveolar distension these vessels are compressed. This increases the intra-alveolar PVR. However, at low alveolar (lung) volumes, the extra-alveolar vessels are small because of the small transmural vascular pressure gradient, and their PVR is high. With increasing lung distension, the intrathoracic pressure becomes more subatmospheric. This elevates the transmural vascular gradient and is coupled with the radial traction on these vessels by the surrounding lung parenchyma as it expands. Thus, the extra-alveolar PVR decreases. The greatest cross-sectional area exists in the many intra-alveolar vessels, hence increasing PVR in these vessels offsets decreased extra-alveolar PVR. Thus, total pulmonary vascular resistance is increased at higher alveolar volumes when intra-alveolar PVR is high. PVR is minimal at FRC, where there is air enough to open the extra-alveolar vessels with minimal closure of the intra-alveolar vessels. Pulmonary artery pressure. A healthy person at rest (FRC) has approximately half of the pulmonary capillaries open, but with increasing arterial pressure, the previously closed capillaries open (recruitment). As the arterial pressure continues to rise, the capillaries become distended. The net effect is a rise in the total cross-sectional area of the lung capillaries, leading to decreased PVR. Left atrial pressure. Patients with high left atrial pressure have distended capillaries due to the venous backpressure. As a result of the reduced driving pressure their PVR is decreased further. Gravity. The pulmonary bloodflow per unit lung volume is greatest at the lower and decreases towards the upper lung regions. Gravity creates a gradient of vascular pressures from the top to the bottom of the lungs. The intravascular pressure is much lower at the upper than at the lower lung regions, unlike the alveolar pressure, which is essentially constant throughout the lung. At the top of the lung all vascular pressures can approach zero (with the alveolar pressure as reference). Under these conditions there is no bloodflow through the upper region, and if it is still ventilated, it is an alveolar dead space. Active modification is essential: Both sympathetic and parasympathetic fibres sparsely innervate the pulmonary blood vessels. Sympathetic stimulation constricts the pulmonary vessels, whereas parasympathetic stimulation dilatates them. Vasoconstrictive agents include: Arachidonic acid, catecholamines, leucotrienes, thromboxane A, prostaglandin F, angiotensin-II, and serotonin. The vasodilatators are acetylcholine, bradykinin, nitric oxide (NO) and prostacyclin. A decrease in PAO2 in an occluded region of the lung produces hypoxic vasoconstriction of the vessels in that region as mentioned above. The reduced PAO2 causes constriction of the precapillary muscular arteries leading to the hypoxic region. The hypoxic effect is not nerve-mediated. This reaction shifts blood away from poorly ventilated alveoli to better-ventilated ones. NO seem to dilatate the vessels of the well-ventilated segments of the lung. Perfusion is hereby matched with ventilation. Milic-Emili has developed the elegant onion skin diagram of the regional ventilation (Fig. 14-10). The first 25% of the lower abscissa is the residual volume or RV, and this axis shows the total lung capacity (TLC) up to 100% TLC (maximal inspiration). The upper abscissa shows the vital capacity, VC, from zero to 100%. The ordinate is the regional ventilation volume in % of the maximal regional total lung capacity (TLC). The maximal regional TLC is any given lung region totally filled with air by a maximal inspiration (Fig. 14-10). The slope of the onion skin-lines are constant above FRC, thus the fraction of the tidal volume reaching each lung region, must be constant during the whole inspiration from FRC (Fig. 14-10). The slope is larger in the lower than in the upper lung region, because the lower alveoli are the ones most compressed by the gravity-sensitive pleural pressure. Accordingly, they can distend most during inspiration. The upper alveoli are always more expanded than the lower due to the pull of gravity. The upper alveoli follow the first in - last out principle. During expiration to residual volume (RV) the upper alveoli are the last to empty (Fig. 14-10). - During inspiration from RV, the lower alveoli are closed up to FRC (closing volume and closing capacity - see the horizontal blue curve in Fig. 14-10). Around FRC the lower alveoli open. At the start of the inspiration from FRC the lower alveoli are the smallest, so any inspiration will always distend the lower alveoli most.
Fig. 14-10: The relative, regional ventilation (ordinate) depending upon total ventilation from RV to TLC (modified from Milic-Emili). The upper alveoli are always expanded by gravity. At TLC all alveoli are assumed to be maximally distended (Fig. 14-10). The alveoli and small airways are increasingly distended from the lower to the upper lung regions. As a consequence, their compliance must decrease progressively, and the pleural pressure also decreases towards the top of the lung (Fig. 14-5). The multiple inert gas technique has confirmed that the major problems in pulmonary disorders are not true shunts, diffusion barriers, and lamination of alveolar gases, but dominantly ventilation/perfusion inequality with functional veno-arterial shunts and alveolar deadspace. This paragraph deals with 1. Hypocapnia, 2. Acute hypercapnia and 3. Vascular lung disorders. - Hypoxia is described in Chapter 15. Hypocapnia or hyperventilation is a disorder with abnormally reduced PaCO2. The hyperventilation reduces PaCO2 and produces an acute respiratory alkalosis, characterised by increased pH, and normal or unchanged Base Excess (BE = Zero). Changes in Base Excess are effected by renal mechanisms, which take hours to develop. 2. Acute hypercapnia (CO2-poisoning) Hypercapnia is a condition, where PaCO2 is higher than 6.4 kPa (48 mmHg). Patients with a large dead space and V°A /Q°° -mismatch develop hypercapnia, due to hypoventilation. Reduced alveolar ventilation increases PCO2 and lowers PO2. Since the CO2 stores are much larger than the O2 stores, the initial rise of PCO2 is lower than the drop in PO2. Thus, the R-value must fall, as seen typically in anaesthetic depression of the respiratory centre. The arterial tensions follow the alveolar. The changes in mixed venous tensions are small, because Q° is maintained and the slope of the oxyhaemoglobin dissociation curve is steep at a mixed venous PvO2 around 45 mmHg. The patient with acute hypercapnia is flushing, nervous, horrified of death, and has increasing dyspnoea. The death-horror and hallucinations are followed by loss of consciousness and respiratory arrest. The blood gases show increased PaCO2 and reduced pH (acute respiratory acidosis, Chapter 17) with a base excess of zero. For patients with chronic pulmonary disease, the hypoxia increases the 2,3-DPG concentration in the red cells, which - together with the hypercapnia and fever - displaces the oxyhaemoglobin curve to the right. This is beneficial for tissue oxygenation, because it increases the tissue tension gradient during oxygen unloading .
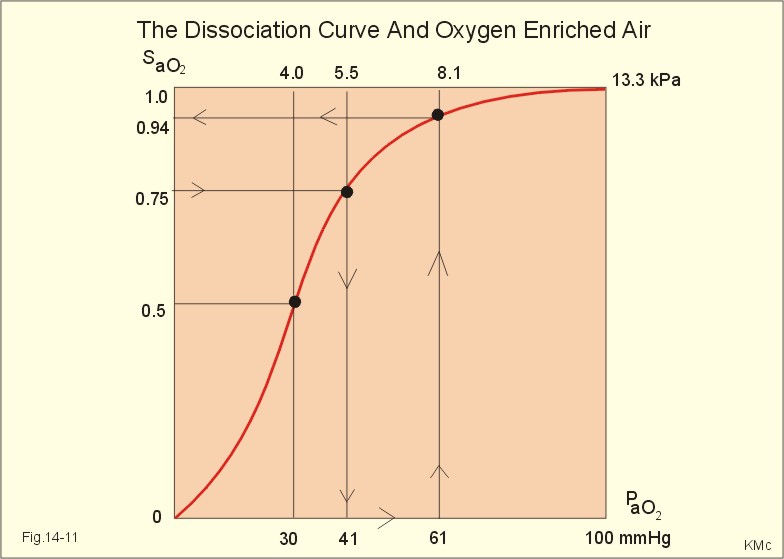
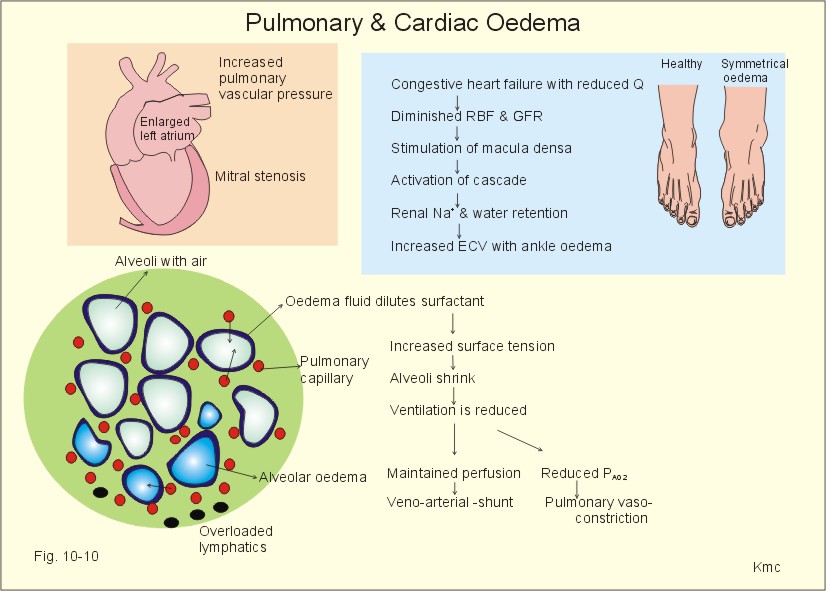
Fig. 14-11: The oxyhaemoglobin dissociation curve. Abnormal blood gas values are indicators of the severity of the disorder. The first phase is characterised by normal blood gases at rest. The second phase is respiratory insufficiency with abnormal blood gases at rest (hypoxia: PAO2 less than 7.3 kPa or 55 mmHg, and hypercapnia: PaCO2 higher than 6.4 kPa or 48 mmHg). The term terminal respiratory insufficiency refers to the grave prognosis. Hypoxia is dangerous because its effects are irreversible, while hypercapnia is reversible. The oxygen treatment increases PaO2, which is vital, so oxygen therapy should be administered instantly to patients with hypoxia – irrespective of hypercapnia. A few patients may have adverse effects with respiratory arrest, when the hypoxic drive for the peripheral chemoreceptors is eliminated. The ventilation will fall, which elicits a substantial rise in PaCO2 with anaesthetic effect on the respiratory centre. The advantage of oxygen enriched air can be shown by an example. A patient with asthma is hospitalised with a PaO2 of 5.5 kPa (41 mmHg) and a SaO2 of 0.75 (Fig. 14-11). Oxygen enriched air is valuable to such a patient. Oxygen enriched air is administered with a nasal catheter or accurately with a simple plastic mask using the Venturi or Bernoulli principle (Chapter 13). A small increase in the oxygen concentration of atmospheric air from 21% to 24% leads to a rise in PIO2 (3% of 95 kPa is 2.9 kPa; 3% of 713 mmHg is 21.4 mmHg). The major part of this rise reaches the arterial blood (2.6 kPa or 20 mmHg) and this rise in PaO2 from 41 to 61 mmHg is often enough to save the patient, because SaO2 increases to 0.94 (Fig.14-11). The oxygen flux to the tissues depends upon a normal haemoglobin concentration and a normal cardiac output. Diseases of the pulmonary vascular tree are diagnosed as pulmonary oedema, pulmonary embolism, and pulmonary hypertension. 3a. Pulmonary oedema is an emergency caused by filtration of fluid out of the pulmonary capillaries into the interstitial space (interstitial oedema), and eventually in the alveolar spaces (alveolar oedema) – see Fig. 10-10. The amount of fluid filtered out of the pulmonary capillaries is determined by the Starling equation (Eq. 8-7). The capillary hydrostatic pressure is the main outward force, and this pressure is larger at the base than at the apex of the upright lung. The main inward force is the colloid osmotic pressure of the proteins of the blood. Normally, the alveoli are kept free of fluid, because a net outflux of fluid from the vasculature is balanced by a small lymph flow to the hilar lymph nodes. Pulmonary oedema has at least 3 causes: 1. Increased pressure. Patients with left cardiac failure (acute myocardial infarct, chronic myocardial failure, mitral stenosis, aortic stenosis, and hypertension) can drown in their own plasma transudates. The increased venous backpressure distends all pulmonary vessels (lung congestion), and as soon as the pulmonary capillary pressure is higher than the colloid osmotic pressure (normally 3.3 kPa or 25 mmHg), there is a filtration of plasma water into the pulmonary interstitial tissues and into the alveoli. The pulmonary vascular pressure rises in the supine position causing attacks of lung oedema to occur at night. 2. Increased capillary permeability. Pulmonary oedema can be caused by capillary damage with war gas, toxins, pneumonia etc. 3. Reduced concentration of plasma proteins increases net filtration at the arteriolar end of the lung capillary and reduces net reabsorption of filtered fluid at the venular end. Oedema is particularly serious in the lungs, because it widens the diffusion distance between the alveolar air and the erythrocytes. There is not enough time for oxygen to travel from the air to the individual erythrocyte. Thus, the blood leaving the lungs is only partially oxygenated. Both the VC and the compliance are reduced. Increased pulmonary capillary pressure is caused by any type of left ventricular failure (acute myocardial infarction or chronic heart failure) and by mitral valve stenosis. A pressure above 2.6 kPa (20 mmHg) causes interstitial oedema, and as the pressure rises above 4 kPa, alveolar oedema develops. Interstitial oedema may not be recognised, but alveolar oedema is dramatic. The patient is severely dyspnoeic, with tachypnoea, tachycardia, and coughing up a frothy pink sputum containing red cells. There is basal crepitation by auscultation and often whistling rhonchi. Since the fluid-filled alveoli are not ventilated with air, any blood passing them does not participate in gas exchange. The effect is a functional veno-arterial shunt with hypoxaemia, although hypoxic vasoconstriction tends to reduce its size. Initially, the non-affected alveoli are overventilated and PACO2 is low. Hypercapnia is a late complication when the gas exchange is severely compromised. Other causes of pulmonary oedema include decreased colloid osmotic pressure (hypoproteinaemia, overtransfusion), increased capillary permeability (pulmonary oxygen toxicity, radiation damage), and high-altitude oedema. · Primarily, it is important to find the cause of pulmonary oedema, such as left cardiac failure, and correct the disorder. · Patients with chronic cardiac failure have reduced contractility, which improved by positive inotropic agents such as digoxin. · Patients with lung oedema must sit up erect in bed with the legs over the side and calm down. This reduces venous return and cardiac output, and the effective filtration pressure is reduced. · Breathing of air enriched with oxygen reduces hypoxia and dilatates the lung vessels. The filtration pressure is reduced. · Effective diuretics increase the excretion of Na+ and thus of water via the kidneys. The loss of fluid also implies oedema fluid. · Positive pressure breathing is thought to minimise the difference between the central and the peripheral venous pressure, so the venous return and thus cardiac output is reduced. The blockade of lung capillary bloodflow in the overpressure-phase, and the fear of the patient (increases cardiac output) does not make this treatment the best of choice. The effect is probably similar to the earlier application of bloodletting tourniquet to reduce the pressure gradient from the left to the right atrium. is caused by detached parts of thrombi from the venous system. The dislodged thrombus is carried with the venous blood to the pulmonary artery, where the lower lobes are frequently affected, due to their relatively high bloodflow. The lung tissue is ventilated but not perfused, so the gas exchange suffers and hypoxaemia develops. Destruction of lung tissue of the affected area (pulmonary infarction) is rare, due to the continued oxygen supply by the airways and by the bronchial artery. The condition can develop into acute cor pulmonale, which is sudden failure of the right heart. Immobilisation by prolonged bed rest, local damage of venous walls with thrombophlebitis, and hypercoagulability of the circulating blood are predisposing conditions. is a condition with a mean pulmonary artery pressure above normal (ie. a pressure above 2 kPa or 15 mmHg). Pulmonary hypertension is caused by increased left atrial pressure (left ventricular failure, mitral valve stenosis), increased pulmonary bloodflow (congenital heart disease with left-to-right shunting of blood through septal defects or a persistent ductus arteriosus), and by increased resistance of the pulmonary vessels (destruction of the capillary bed in emphysema, obstruction in pulmonary embolism, hypoxic vasoconstriction in chronic bronchitis with emphysema and at high altitude). Persistent pulmonary hypertension leads to right ventricular hypertrophy and finally to chronic cor pulmonale. This is often the final stage of not only chronic obstructive lung disease in smokers, but also of the late restrictive lung disorder. · The Fick cardiac output equation states that the cardiac output is calculated from the ratio between alveolar oxygen uptake and arteriovenous oxygen content difference: Eq. 14-1: Q° = V°O2/( CaO2 - Cv¯O2) . · Fick's law of diffusion states that the flux of gas transferred across the alveolar-capillary barrier is directly related to the solubility (Bunsen’s a, Table 13-1) of the gas, the diffusion area (A), the length of the diffusion pathway from the alveoli to the blood (L), and the driving pressure (P1 - P2): Jgas = (D × a × A × 1/L) × (P1 - P2). Marie Krogh incorporated molecular weight (mol. weight), a, A, and L in her lung diffusion capacity (DL). DL is equal to a constant, K, multiplied with a, and divided by the square root of the mol. weight. Thus DL = K × a/ Ömol. weight. This relationship is used on all three gases: DLC0 = K × 0.018/Ö28 ; DLCO2 = K × 0.51/Ö44; and DL02 = K × 0.022/Ö32. Thus: DL02/DLCO = [K × 0.022/Ö32]/(K × 0.018/Ö28) = 1.14. DLCO2/DLCO = [K × 0.51/Ö44] /(K × 0.018/Ö 28) = 22.6. Hereby she eliminated all the unknown variables, and for carbon monoxide, Ficks law of diffusion is simplified to: Eq. 14-2: ( Jgas =) V°CO = D PCO × DLC0 · The alveolar gas equation ( PIO2 -PAO2) = PACO2 *[ FIO2 + (1-FIO2 )/R ] in terms of alveolar gas tensions. We can simplify the alveolar gas equation for R=1: Eq. 14-3: FIO2 - FAO2 = FACO2 or PIO2 - PAO2 = PACO2. · The alveolar ventilation equation describes the hyperbolic relationship between alveolar ventilation (V°A ) and FACO2 : Eq. 14-4: V°A = V°CO2/ FACO2 . FACO2 is equal to [PACO2/(101.3 - 6.3) kPa], so PACO2 is easily substituted for FACO2. · The final ventilation-perfusion (V°A / Q° ) equation Without showing the calculations, one equation combines Eq.s 14-1 to 14-4: Eq. 14-5: V°A / Q° = R( CaO2 - Cv¯CO2) / FACO2. The V°A / Q° -ratio is obviously independent of the metabolic rate or oxygen uptake. V°A / Q°- ratio is the key variable, because we all have a certain degree of ventilation - perfusion mismatch, and in almost all cardiopulmonary patients this mismatch is consequential. · The total tension of all three dry gases is equal to (PO2 + PCO2 +PN2) or the barometric pressure (PB) minus the tension of water vapour in the alveolar air at 37o C. The total tension at PB=760 mmHg is thus (760 - 47) = 713 mmHg or (101.3 - 6.3) = 95 kPa. Eq. 14-6: (PB - 47) = (PO2 + PCO2 +PN2). · The law of mass balance is applied to both bloodflow and oxygen flux in the following two equations: Eq. 14-7: Q° total = Q°°shunt + Q° capillary Eq. 14-8: (Q° total · CaO2)= (Q° shunt · Cv¯O2 )+ (Q°capillary * Cc´02) where Cc´02 is the oxygen concentration in the pulmonary end capillary blood from ideal lung units (Fig. 14-8). · The flow and flux relations implies the following shunt equation: Eq. 14-9: Q° shunt/ Q° total = (CaO2 - Cc´02)/( Cv¯O2 - Cc´02). · The CO-Oxy-haemoglobin affinity equation: Eq. 14-10: CaCO/PaCO = 250* CaO2/PaO2. CO has a standard affinity for haemoglobin 250 times larger than that of oxygen for haemoglobin: CaCO/PaCO : CaO2/PaO2 = 250 : 1. · Dalton’s law states that the partial pressure or tension of a single gas in a mixture is equal to the product of the total pressure and the mole fraction (F). According to Daltons law the fraction of oxygen in the alveolar air (FAO2) is: Eq. 14-11: FAO2 = PAO2/(101.3 - 6.3) = PAO2/(760 - 47). With an alveolar partial pressure of oxygen (PAO2) of 13.3 kPa (or 100 mmHg), the FAO2 is 0.14. There is no interaction between gases. · Henry’s law states that the number of gas molecules dissolved in a fluid is directly proportional to the partial pressure of the gas in air above the fluid. According to Henrys law the concentration (C) of dissolved gas is proportional to its partial pressure (P) and the solubility (a or Bunsen’s solubility coefficient, Table 13-1): Eq. 14-12: C = P * a. With the pressure given in kPa or mmHg it is necessary to divide by 101.3 kPa or 760 mmHg, respectively, because a is defined at 1 atm.abs. pressure. Each of the following five statements have True/False options: A. The pulmonary vascular pressure and resistance (PVR) is only 1/10 of that of the systemic circulation. B. The PVR is highest in intra-alveolar vessels at high lung volumes. C. The PVR increases when pulmonary arterial pressures increase. D. The pulmonary circulation is dependent on gravity but the pulmonary ventilation is not. E. The PAO2 has a direct effect on pulmonary circulation. A male person, ages 23 and weight 70 kg, is breathing atmospheric air with traces of carbon monoxide (CO) at one atmosphere. The man is at rest, and has an arteriovenous oxygen content difference of 50 ml per l. An arterial blood sample obtained after equilibrium between alveolar air and pulmonary blood is analysed with the following results: PaO2 13.3 kPa (100 mmHg), CaO2 170 ml STPD per l, CaCO (the concentration of CO in the blood) 28.3 ml STPD per l, and the [haemoglobin] 9.18 mM (148 g per l). The standard affinity between haemoglobin and CO is 260 times greater than the standard affinity between haemoglobin and oxygen. The binding capacity for oxygen and CO is 1.34 ml STPD per g of haemoglobin. 1. Define the concept standard affinity and P50. 2. Calculate the dry CO-fraction in the alveolar air (FACO). 3. Calculate the concentration of oxygen in the mixed venous blood of this patient. 4. Calculate the concentration of oxygen in the mixed venous blood of a comparable patient with anaemia (haemoglobin concentration 7.78 mM) and with the same arterio-venous oxygen content difference. 5. Is the oxygen supply to the tissues at the venous end of the capillaries better for the CO-poisoned person than for the anaemia patient? A 49-year-old female, body weight 61 kg and height 1.7 m, is hospitalised due to severe, progressive dyspnoea. Six years ago the diagnosis of pulmonary sarcoidosis was established by mediastinal lymph node biopsy. The cause of the disease is unknown, and the patient has no history of previous lung disease. When stair climbing the patient has difficulties in reaching the 2. floor. The spirometric standard values for a female of this age, height and weight are: forced expiratory volume on 1 s (FEV1) of 2.9 l, and forced vital capacity (FVC) of 3.7 l. The patient has a FEV1 of 1.3, and a FVC of 1.48 l. The patient has an unforced VC of 1.6 l, with an ERV of 300 ml, tidal volume of 600 ml and an IRV of 700 ml, as compared to a normal VC of 3.9 l. The normal specific lung compliance (at FRC) is 2 ml per Pascal (Pa); for this patient it is determined to only 0.4 ml per Pa at FRC. The normal single-breath CO diffusing capacity is 3 ml STPD s-1 kPa-1, but this patient has only 0.5 ml STPD. An arterial blood sample shows a PaCO2 of 4 kPa (30 mmHg) and a PaO2 of 8 kPa (60 mmHg). 1. What are the arguments for the diagnosis of restrictive lung disease? 2. Why is the single-breath CO diffusing capacity seriously reduced? 3. Is there any indication of alveolar ventilation-perfusion mismatch? Following 3 days of fishing in cold weather, a 30 year old man is brought to hospital with high fever (40.8 Centigrade), coughing with chest pains and red coloured sputum. Rales are heard over both lungs and a chest x-ray show large infiltrates in both lungs. A blood gas analysis on an arterial sample reveals PaO2 of 50 mmHg and PaCO2 of 26 mmHg. pHa is 7.38. The RQ is assumed to be 1, and PB is 760 mmHg. 1. Calculate the alveolar PO2 (PAO2 ) using the alveolar gas equation. 2. Assume a likely value for an ideal gas composition (mean alveolar) just before the man became ill. 3. Calculate the alveolar (ideal) - arterial PO2 difference. What does this difference mean? 4. Calculate the difference between the alveolar ideal PACO2 and the arterial (PaCO2). What does this difference mean? A male, 44 years of age, is brought to hospital due to severe dyspnoea. He has been smoking 40 cigarettes per day in 30 years. Over the last 10 years an increasing respiratory distress has developed, and the patient is well known at the medical department. The arterial blood gas tensions are measured: PaO2 is 60 mmHg (8 kPa), PaCO2 is 35 mmHg (4.7 kPa), and pHa is 7.44. An alveolar gas sample reveals a PAO2 of 129 and a PACO2 of 28 mmHg. 1. Calculate the alveolar-arterial PO2 difference assuming that the ideal PAO2 is 100 mmHg (13.3 kPa). 2. Provide a likely diagnosis, which explains his respiratory distress. 3. Is there an abnormally high alveolar dead space? A female surgeon, 56 years old, has smoked 25 cigarettes a day for almost 40 years. Her dyspnoea from stair climbing has increased substantially over the last three years as has her morning cough with abundant green sputum in big lumps. A chest X-ray shows hyperinflation, bronchial expansions and a distinct vascular pattern. The surgeon is examined at the respiratory laboratory including function tests and arterial blood gases with the following results: FEV1 = 1.1 l (normal 2.6 l) ; Forced Vital Capacity (FVC) = 1.9 l s-1 (normal 3.4 l s-1 ); PaCO2 = 56 mmHg or 7.5 kPa; pHa = 7.21; PaO2 = 49 mmHg or 6.5 kPa; Base Excess = - 5 mM. 1. What is the cause of the disease? 2. Characterise the acute condition including the acid-base status. 3 From where in the upper airways do the big lumps of green sputum arise? Try to solve the problems before looking up the answers. · Any patient - as well as any healthy person - has some degree of ventilation-perfusion mismatch. · The regional ventilation-perfusion-ratio is the key to understanding cardiopulmonary function. · The regional ventilation-perfusion ratio varies theoretically from zero at the lower lung region (only bloodflow) to infinity at the upper region (only ventilation). · The upper alveoli are always more expanded than those of the lower due to the pull of the gravity are, and they did follow the first in-last out principle: During inspiration the first to fill – during expiration the last to empty. · The regional ventilation-perfusion ratios show the lower lung regions to be relatively underventilated (ratio below one), the middle lung regions to be well matched (ideal ratio of 1), and the upper lung regions to be relatively overventilated (ratio above 1 and approaching infinity. · Pulmonary embolism creates an alveolar dead space. The alveolar ventilation of the region is maintained, but there is no bloodflow, so the V°A / Q° -ratio of the lung region approaches infinity. In the alveolar dead space, alveolar gas pressures approach the levels of inspired air. · Tracheal occlusion represents an extreme mismatch of venous to arterial shunting of blood, namely perfusion with no ventilation at all (ie, the total ratio for the person approaches zero). The arterial blood gas tensions approach those of venous blood. · The pulmonary vascular system is basically a low-pressure, low-resistance, highly compliant vascular system, which is meant to accommodate the entire cardiac output. · The standard affinity of the haemoglobin-CO reaction is 250 times greater than that of haemoglobin-O2 . · The single-breath CO diffusing capacity (transfer factor) is normally 3 ml STPD s-1 kPa-1 at rest and 7.5 during maximal exercise. · Uneven distribution of tidal volume can eventuate from uneven resistance to airflow within the lung (bronchoconstriction, collapse and compression of airways) or from uneven regional lung compliance (insufficient surfactant, loss of elastic recoil as in destruction of alveolar tissue, and increase of elastic recoil as in connective tissue scarring or fibrosis with stiff lungs). · Hypoperfusion can be caused by compression of pulmonary vessels, obliteration of vessels by fibrosis, or blockage by emboli or thrombosis. · Functional shunts arise with any consolidation of alveolar regions that continue to have bloodflow (pneumonia, oedema, haemorrhage, cell necrosis, lack of surfactant). · Patients with lung disorders often have V°A / Q° -mismatch by a combination of serious veno-arterial shunting in the lower lung regions, and increased alveolar dead space in the upper lung regions. · A healthy person at rest (FRC) has approximately half of the pulmonary capillaries open, but with increasing arterial pressure, previously closed capillaries open (recruitment). · Pulmonary oedema is an emergency caused by filtration of fluid out of the pulmonary capillaries into the interstitial space (interstitial oedema), and eventually in the alveolar spaces (alveolar oedema). · Patients with left cardiac failure (acute myocardial infarct, chronic myocardial failure, mitral stenosis, aortic stenosis, and hypertension) can suffocate, when the alveoli are filled with oedema fluid. · The gas exchange of the chronically ill lung patient is reduced over the years, and abnormal arterial blood gas tensions develop already at rest. This late stage of lung disease is called terminal respiratory insufficiency, due to the grave prognosis. West, J.B. Respiratory Physiology: The Essentials. 8th Ed . Williams & Wilkins, Baltimore. USA, 2008. Änggård, E. "Nitric oxide: mediator, murderer, and medicine." Lancet 343: 1199-1206, 1994.
|
||||||||||||||||||||||||||||||||||||||||||||||||||||||||||||||||||||||||||
.jpg)
Click here to introduce your comments or contributions