New Human Physiology | Paulev-Zubieta 2nd Edition
Chapter 11: Cardiac Action Potencials and Arrhythmias
| HOME | PREFACE | TABLE OF CONTENTS | SYMBOLS | SECTION INFO | CONTRIBUTORS | LINKS | CONTACT US |
Highlights
Study_ObjectivesPrinciplesDefinitionsEssentials
PathophysiologyEquationsSelf-AssessmentAnswers
Further Reading
|
Chapter 11
|
 |
|
|
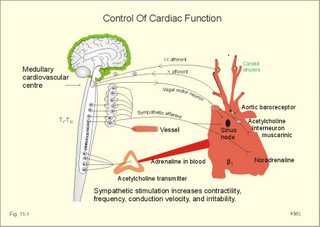
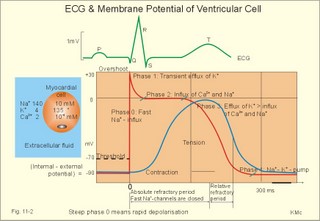
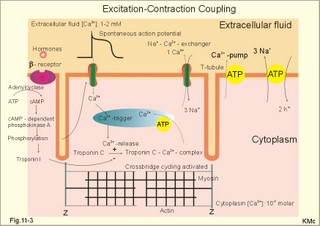
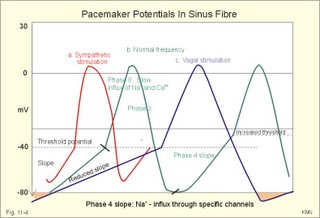
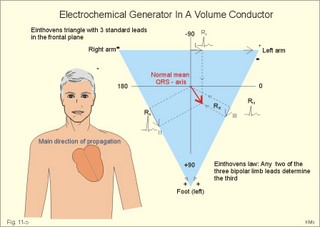
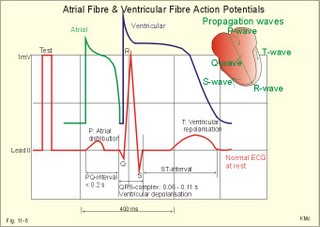
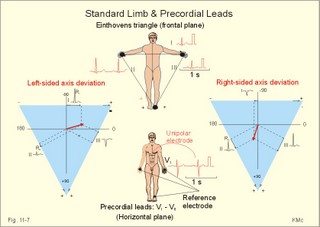
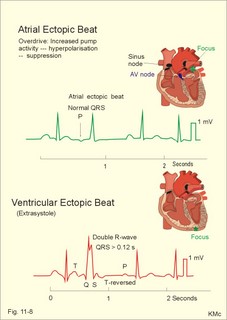
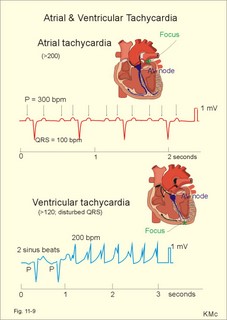
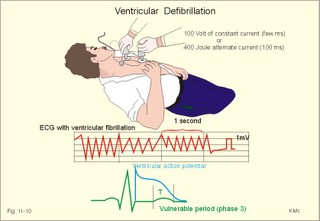
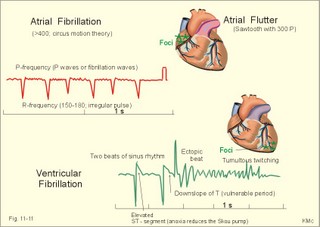
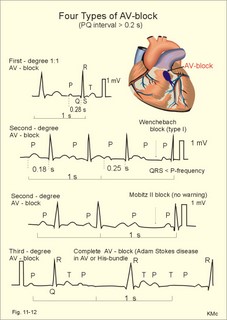
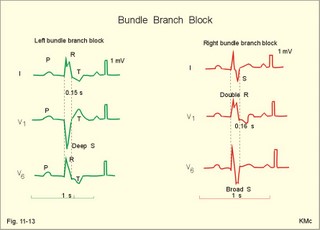
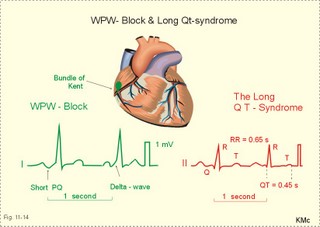
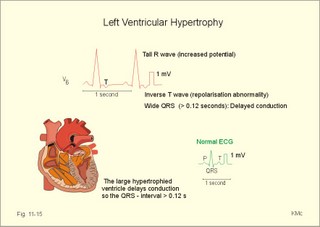
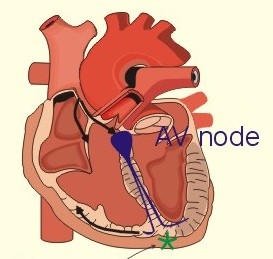
· To define asystolia, atrial fibrillation, atrial flutter, axis-deviation, bradycardia, heart block, tachycardia, sinus rhythm, ventricular fibrillation, ventricular tachycardia and vulnerable period.· To describe cells with pacemaker-function, the normal impulse conduction in the heart, the recording of the electrocardiogram (ECG), and different types of heart block. · To draw membrane potentials of sinus cells, atrial cells, and myocardial cells during a cardiac cycle, and draw a normal ECG. · To estimate the electrical QRS-axis from the R-waves of the standard limb leads. · To explain the effect of the autonomic nervous system on the membrane potential of the sinus node. To explain the genesis of the ECG in health and disease. To explain the Adam-Stokes syndrome. · To use these concepts in problem solving and case histories. The body conducts electrical signals uniformly in all directions (an almost uniform volume conductor increasing the potential electrical field around the heart generator). · Einthoven’s law states that any two of the three bipolar standard limb leads determine the third one with mathematical precision. · An electrocardiogram (ECG) is a curve showing the potential variations against time in the whole body stemming from the heart, which is an electrochemical generator suspended in a conductive medium. · Asystolia refers to cardiac arrest. · Atrial fibrillation is a continuous atrial activation with 400 or more contractions per min. Contractions spread through the atrial tissue almost without mechanical effect and only few electrical signals are conducted to the ventricles. Atrial flutter is an atrial contraction rate around 300 per min, often with every second contraction conducted to the ventricles. Sawtooth-like flutter waves characterise the ECG.· Bradycardia is an unduly slow heart rate. Sinus bradycardia is a sinus rhythm at rest below 60 beats per min during the day or less than 50 at night. · Calcium concentration in plasma (total): Normal range is 2-2.5 mM. · Heart block is a blockage somewhere along the pathway for impulse conduction in the heart. · Mean QRS- axis of the ventricles or the mean cardiac vector is the net force in the frontal plane during ventricular depolarisation and repolarisation. Many electrical potentials are propagated in different directions and most of these cancel each other out. The main direction of the mean cardiac vector is from the base of the ventricles towards the apex. · Left-sided axis deviation is characterised by a positive RI and a negative RIII (Fig. 11-7). Cardiologists use the net area of the QRS-complex for precise diagnosis. · Pacemaker cells are small pale cells located in the sinus node of the heart. The sinus node is the primary determinator of the cardiac rhythm, because its cells have the highest spontaneous frequency. · Potassium concentration in plasma: Normal range is 3.5-5 mM. · Right-sided axis deviation is characterised by a negative RI and a positive RIII (Fig. 11-7). Cardiologists use the net area of the QRS-complex for precise diagnosis. · Sinus rhythm refers to the normal cardiac pacemaker rhythm from the sinus node. The spontaneous discharge at rest is usually 100 beats per min, but the parasympathetic inhibitory tone predominates in healthy individuals resulting in a resting heart rate around 75 beats per min. · Tachycardia refers to a cardiac rate above 100 beats per min. Sinus tachycardia is a sinus rhythm above 100, which can be caused by anaemia, cardiac failure, catecholamines, emotion, exercise, fever, pregnancy, pulmonary embolism or thyrotoxicosis. · Ventricular tachycardia is defined as three or more ventricular beats occurring at a rate of 120 beats per min or more. · Ventricular fibrillation is an extremely rapid ventricular activation without pumping effect. Electrical defibrillation is the only effective therapy. · Vulnerable period is a dangerous period in cardiac cycle just at the end of the contraction (simultaneous with the T-wave in the ECG). Electrical conversion (an electrical shock) given during this period may in itself initiate ventricular fibrillation. Refractory areas of cardiac muscle are spread among non-refractory areas. This paragraph deals with 1. Neural regulation of the heart function, 2. The action potential, 3. The role of calcium, 4. Spontaneous depolarisation, 5. Development of electrocardiography, and 6. The normal ECG. 1. Neural regulation of the heart function A large number of sympathetic (S) and vagal (X) motor nerve fibres end close to the sinoatrial node (SA in Fig. 11-1). Fig. 11-1: The neural control of the heart. Sympathetic stimulation speeds up the sinus node (sinus tachycardia) and vagal activity slows the node (sinus bradycardia). Increased concentration of the sympathetic transmitter noradrenaline, and of adrenaline from the adrenal glands, cause positive inotropic state (increased contractility), positive chronotropic state (increased frequency), positive dromotropic state (increased conduction velocity), and positive bathmotropic state (increased irritability) on the heart. Noradrenaline activates a-adrenergic constrictor receptors in the coronary vessels, whereas adrenaline activates b-adrenergic vasodilatator receptors. The neurotransmitter acetylcholine, activating muscarinic receptors, and vagal stimulation causes reduced contractility (negative inotropy), reduced frequency (negative chronotropy), reduced conduction velocity (negative dromotropy), and reduced irritability (negative bathmotropy). Across the ventricular cell membrane there is a steady potential difference of almost the same size as the equilibrium potential for K+ (-94 mV), that is -90 mV (Fig. 11-2). This negative potential is referred to as the resting membrane potential (RMP), because it represents the potential difference across the cell membrane (inside negative) at rest between successive action potentials. Fig. 11-2: Recordings of ECG (above), intracellular membrane potential (red curve) and contraction (blue curve) of one heart cycle in a ventricular fibre. Any process that reduce the absolute size of the RMP (ie, depolarise the membrane) tends to activate (open) fast Na+-channels. These channels contain fast opening and fast closing gates (inactivation gates). Electrochemical forces favour the abrupt influx of Na+ from neighbouring regions. Hereby, the potential is further diminished and more and more Na+-channels are activated or opened. The threshold potential for release of an action potential is a rise of 25 mV from -90 mV. The cardiac action potential is an all-or-none response, which can be divided into five phases: The fast depolarization (phase 0) is shown by the abrupt upstroke, which is related to the rapid entry of Na+ into the cell through the fast Na+-channels, suddenly allowing the electrostatic and chemical forces to work (Fig. 11-2). The fast Na+-influx causes phase 0 of atrial, ventricular and Purkinje action potentials (Fig. 11-2). The fast Na+-channels are both voltage- and time-dependent. Phase 0 stops at about +30 mV, because the fast Na+-channels become voltage-inactivated by closure of inactivation gates. The potential difference approaches the equilibrium potential for Na+ (+ 60 mV), but only reaches +30 mV. The conduction velocity along the fast response fibre increases with the AP-amplitude and especially with the slope of phase 0. Phase 1 is the early repolarization from the upstroke. This is related to K+-outflux. Phase 2 is the plateau of the action potential, where the slow Ca2+-Na+-channels remain open for a long period - up to 300 ms. The net influx of Ca2+ and Na+ is almost balanced by a net efflux of K+, so the balance is forming the plateau (Fig. 11-2). Ca2+ activates the muscle contractile process. When the slow Ca2+-Na+-channels close at the end of the plateau, the voltage-gated K+-channels are activated, and the permeability for K+ increases rapidly. Phase 3 is the terminal repolarization. With all the K+-channels open, large amounts of K+ diffuse out of the ventricular fibre. The equilibrium potential for K+ (-94 mV) and the RMP is rapidly approached. Phase 4 is recognized by the RMP of - 90 mV (Fig. 11-2). The Na+-K+ pump restores ionic concentrations by exchanging Na+ for K+ in a ratio of 3:2. Phase 5 covers the relative refractory period (RR), and the T-wave in the ECG. The long absolute refractory period (AR) of the ventricular cells covers the whole shortening phase of the contraction (Fig. 11-2 blue curve). In the absolute refractory period all fast Na+-channels are voltage-inactivated and closed, which prevents sustained tetanus. As a consequence, no stimulus is sufficient to trigger contraction regardless of size. In the relative refractory period, enough of the fast Na+-channels are recovered, so that a sufficiently large stimulus can break through and produce an action potential although smaller than normal. The long absolute refractory period protects the cardiac pump, as it is not possible to bring ventricles into smooth tetanus. As described above the cardiac muscle fibre has a horizontal plateau, because of the slow Ca2+-Na+-channels (phase 2). - Skeletal muscle fibres have no plateau, because they do not open slow Ca2+-Na+-channels for such a long time. Cardiac fibres contain many mitochondria and intercalated desks with gap junctions, transverse tubules of invaginated sarcolemma, and sarcoplasmic reticulum (Fig. 11-3). The fibres require a continuous supply of oxygen and they are provided with a rich capillary supply, about one capillary for each cardiac fibre. The spontaneous firing from the pacemaker spreads over the entire heart as a propagating wave. The wave of excitation is conducted rapidly along the long axis of a cardiac fibre, and spreads along the myocardial sarcolemma from cell to cell via electrically conducting gap junctions. The excitation also reaches the interior of the cell through the large T-tubules filled with mucopolysaccharides. During the phase 2 plateau of the action potential, Ca2+ permeability increases, and Ca2+ flows down its electrochemical gradient into the cell through the slow Ca2+-channels. The channel proteins are phosphorylated by a cAMP-dependent protein kinase A. The small Ca2+ influx is called trigger-Ca2+, because it releases large amounts of Ca2+ from the sarcoplasmic reticulum (Fig. 11-3). Hence the cytoplasmic [Ca2+] increases from the resting level of 10-7 molar by a factor of 10-100 during excitation. The free Ca2+ binds to troponin C, just as in striated muscle cells, and the complex interacts with tropomyosin to activate sites between the actin and the myosin filaments. This process starts crossbridge cycling and thus contraction of the myofibrils. Fig. 11-3: Excitation-contraction coupling in a cardiac fibre. When the Ca2+-influx ceases at the end of systole, the Ca2+ -movement is reversed. Now, Ca2+ is pumped into the sarcoplasmic reticulum by a Ca2+ -pump. The binding of Ca2+ to troponin C is inhibited by phosphorylation of troponin I, and the binding sites between actin and myosin are blocked resulting in diastole. In diastole the Ca2+ surplus is removed by a 3 Na+- 1 Ca2+-exchanger, and by an electrogenic Ca2+-pump (Fig. 11-3). Catecholamines and increasing extracellular [Ca2+], raise the cytoplasmic [Ca2+] and thus the developed force of contraction. This is accomplished in the following way. Adrenaline and noradrenaline activate adenylcyclase, whereby cAMP is formed and the dependent proteinkinase A phosphorylates and activates Ca2+-channel proteins (Fig. 11-3). Hereby, the cytoplasmic Ca2+ is increased, and thus the force of contraction. The excitability of cardiac fibres, striated muscle cells and neurons is reduced by a reduction of the cellular Ca2+-gradient (hypocalcaemia), a rise in the Na+-gradient across the cell membrane, or the administration of Ca2+-blockers that prevent Ca2+ from entering the cell. Cardiac glycosides, such as digoxin, are beneficial for patients with chronic cardiac failure. Digoxin inhibits and reduces the number of Na+-K+-pumps in the membranes of cardiac cells, hereby producing high intracellular levels of Na+. Some of the intracellular Na+ is exchanged for extracellular Ca2+, and cytoplasmic Ca2+ enhances the force of cardiac contraction (positive inotropic effect). Exactly the necessary minimum dose of digoxin must be used for each patient with cardiac failure. In myocardial cells, as in nerve and skeletal muscle cells, K+ plays a major role in determining the RMP. At physiologic concentrations of K+ outside the myocardial cell ([K+]o about 4 mM), the RMP is determined by a dynamic balance between the membrane conductance to K+ and to Na+. As [K+]o is increased (hyperkalaemia), the membrane depolarises. Depolarisation inactivates voltage-dependent K+ -channels and activates Na+ -channels, allowing Na+ to make a proportionally larger contribution to the RMP. Increased [K+] in the extracellular fluid reduces the force of contraction, so the heart becomes dilatated and flaccid. Because the equilibrium potential for Na+ is positive (+ 60 mV), it tends to depolarise the RMP. Since RMP is -90 mV at normal [K+], and the equilibrium potential of K+ is always more negative (-94 mV), there is a small outflux of K+ from the cell at equilibrium. The K+ and Na+ gradients are maintained by the efficient Na+-K+-pump. The rhythm of the heart is initiated by a complex flow of electrical signals, which are called action potentials. The action potentials generated in the sinus node (SN) display automaticity (ie, they undergo spontaneous and rhythmic depolarization without external stimuli). The sinus node is the primary pacemaker, because it has the highest frequency. The automaticity (Fig. 11-4) is associated with small pale round cells in the SN. The SN and the AV-node also contain elongated cells that react with a special AP, a so-called slow response. The AP is smaller than the fast response, phase 0 is long and caused by slow Ca2+-influx, phase 1 is absent, phase 2 is slow repolarisation, and the real repolarisation in phase 3 is due to inactivation of the slow Ca2+-channels and increased K+–outflux. Phase 4 is horizontal, and the relative refractory period is long, extending well into phase 4. The slow response propagates slowly and tends to be blocked, which causes cardiac rhythm disturbances. The membrane potential of pacemaker cells (about -55 to -60 mV) is never constant (Fig. 11-4). The diastolic depolarization of pacemaker cells (producing the very special slope in phase 4 of these cells) is ascribed to an influx of Na+ through special channels in their cell membrane. Three or more ionic currents mediate the slow diastolic depolarization: an inward sodium current (i-funny), an inward calcium current and an outward potassium current. Towards the end of phase 4 there is also a certain influx of Ca2+ through voltage-activated Ca+2 -channels. Hypocalcaemia diminishes the amplitude of the action potential and the slope of the pacemaker potential. The diastolic pacemaker depolarization is opposed by the K+-outflux. Fig. 11-4: Pacemaker potentials from a sinus nodal fibre: a: Sympathetic stimulation; b. Normal heart rate; c. Vagal stimulation. There is a constant Na+-influx between two heartbeats. Reduction in the slope of the pacemaker potential and increase of the threshold both diminish the cardiac frequency. The K+-channels remain open during the repolarization, so the membrane potential approaches -60 mV at the end of the action potential. The rising pacemaker potential between two heartbeats, is caused by the inherent leaks of the pacemaker membrane to Na+. The constant Na+-influx causes the membrane potential to approach the threshold potential. When the membrane potential reaches the threshold potential (about -40 mV), the slow Ca2+-Na+-channels open and the cycle starts again. This process continues for a lifetime (Fig. 11-4). The heartbeat is self-initiating, and normally the propagating wave (impulse) originates in the sinus node (see above). The impulse propagates from the sinus node via three bundles of internodal syncytial cells, through the left and right atrial wall to the atrioventricular (AV) node. This point is typically reached within 40 ms. After passing through the AV node (with a so-called AV- delay of 100 ms), the propagating wave (excitation) reaches the bundle of His. Here, specialised conduction fibres activate almost synchronously all the ventricular tissue and thus impart maximal thrust to the blood. The propagation velocity in these large Purkinje fibres is 1-4 m per s, which is the fastest velocity possible in the heart. The Purkinje system terminates just under the endocardial surface on gap junctions in the myocardial cells. The AV-delay provides time for the atrial systole to pass extra blood to the ventricles before the ventricular systole occurs. Adrenergic transmitters and sympathetic stimulation increase the slope of the diastolic pacemaker depolarization. Acetylcholine and vagal stimulation increase the K+-efflux, so the slope is reduced and thus the cardiac frequency is reduced. Some cardiac fibres show a slow response comparable to that of the pacemaker cells, but with a constant phase 4. Ischaemia may activate ectopic pacemaker cells. 5. Development of electrocardiography In 1903 Einthoven began a systematic study, with a string galvanometer of the potential differences between electrodes placed on the skin surface during heart beats. The string galvanometer was developed to become the first electrocardiograph. The fluids of the body conduct electricity quite easily. The body conducts electrical signals uniformly in all directions. An electrocardiogram (ECG) is a curve showing the potential variations in time in the body stemming from the heart, which is an electrochemical generator suspended in a conductive medium acting as a volume conductor. The myocardial cell membranes have separate charges, and small ion gradients produce electrochemical gradients. Small ion fluxes across the cell membrane only occur during depolarization and repolarization, where potential differences are produced between polarised and depolarised tissue regions in the heart. Each cardiac fibre behaves as a dipole, the magnitude and direction of which is symbolised by an arrow or a vector. The dipole vector points from minus to plus by definition. Originally Einthoven assumed that the sum of all electrical activity in the heart resulted in an electromotive force - a main cardiac vector originating in the middle of the heart. Einthoven used three standard bipolar limb leads forming a triangle in the frontal plane (Einthoven’s triangle in Fig. 11-5 and 11-7). Lead I records the potential difference between the right and left arms, lead II between the right arm and left leg; and lead III between the left arm and left leg. The right leg is used to ground the patient (Fig. 11-7; observe the positive and negative signs). The connections were arbitrarily chosen so most healthy individuals had dominating upright (positive) QRS-complexes and T-waves in their leads. The actual recording sites are at the junctions between limbs and trunk, because the arms and legs act as extended electrodes. Einthoven actually placed the limbs of the patient in bathing tubes and used these as the first electrodes. Einthoven arranged the ECG equipment so that the direction of the mean QRS-axis towards the positive pole of a bipolar lead produces an upright deflection (positive R-waves in the 3 leads shown in Fig. 11-5). When directed towards the negative pole a downward deflection (a negative RIII-wave in left-sided axis deviation, Fig. 11-7) was recorded. Einthoven's law states that any two of the three bipolar limb leads determine the third one with mathematical precision. The potential differences recorded over time in an ECG can be estimated using the rules of vectorial projection with force parallelograms in the frontal plane (Fig. 11-5). Fig. 11-5: Einthoven's triangle. To the left is shown the main direction of the conduction system in the frontal plane. The R-waves (and QRS deflections) in two of the three standard leads are drawn graphically in Einthoven’s triangle and their resultant is the mean QRS-axis of the heart or more exact the mean ventricular axis in the frontal plane (Fig. 11-5). This is a mathematical concept representing the integral cardiac vector operating in Einthovens triangle. The mean QRS-axis of the heart is usually located around 60 degrees in Einthoven’s triangle. Right- sided axis deviation is found in children or high thin individuals with a vertical located heart, and in persons with right ventricular hypertrophy. The axis is now located to the right and the condition is diagnosed by a positive RIII combined with a negative RI (between +90 to +180 and even +90 to –90 degrees in Fig. 11-7). Left-sided axis deviation is found with left ventricular hypertrophy, in fat individuals and in late pregnancy, when the heart is pressed upwards to the left. The condition is diagnosed by a negative RIII combined with a positive RI (Fig. 11-7).- Actually cardiologists operate with the net areas of the QRS-complexes in order to diagnose significant deviations. The ECG is recorded from the surface of the body, and used to demonstrate the presence of AV-blocks, ectopic foci, premature beats, sinoatrial arhythmias, atrial fibrillation and ventricular fibrillation etc. Each heart cycle has a fixed pattern of ECG waves (P,Q,R,S and T). The sinus node is a minimal muscle mass, and there is no potential difference (wave in the ECG) before the atria depolarise with a P-wave. When the propagating impulse wave is directed towards the positive electrode (as in lead II) the atrial depolarization will produce a positive P-wave (Fig. 11-6). The P-waves correspond to the impulse distribution in the atria. Retrograde excitation of the atria creates a negative P-wave. When atrial excitation coincides with the QRS, the P-wave is often hidden. The PR-interval (normally 0.12-0.2 s) measures the impulse speed through the supraventricular tissue from the sinus node to the bifurcation of the Hiss bundle. Prolonged PR-interval is caused by disturbances of AV conduction. The QRS-complex measures the passage through the left and right bundle branch followed by depolarization of the strong ventricular myocardium (Fig. 11-6). The QRS-complex is prolonged (> 0.12 s), when the left or right bundle branch is blocked by disease. When excitation originates in the ventricles, it spreads slowly and the QRS-complex is severely deformed. Since the activation of the septum is mainly from left towards right, the propagating wave moves away from the exploring electrode, and the Q-wave becomes negative, whereas the dominating ventricular transfer of the propagating wave towards the apical electrodes provides the large, positive R-wave in almost all leads. The small propagating wave moving away from the electrode at the apex and to the right to reach the thin-walled right ventricle, is responsible for the small, negative S-wave. The T-wave represents ventricular repolarization and has the same direction as the QRS-complex in most normal leads. When the QRS-complex is positive and the T-wave is negative, it indicates that the repolarization proceeds in a wrong direction. Abnormal T-waves are due to cardiac hypertrophy, myocardial damage or electrical disturbances. The isoelectric ST-segment represents the period, where the entire ventricular myocardium is depolarised (therefore isoelectric). Any deviation (up or down from the isoelectric level) indicates anoxic damage of the myocardium. The QRS- plus ST-intervals correspond to the duration of the ventricular systole. Fig. 11-6: Normal ECG (II. lead). The action potentials from an atrial (green curve) and a ventricular fibre (blue curve) are shown above. – To the right is shown the direction of propagating waves in the frontal plane and their relation to the ECG waves. The T-wave is positive in most leads, and due to the apical directed repolarization of the ventricular action potential (Fig. 11-6). Unipolar, precordial leads (Wilson) have one exploring electrode as the actual recording electrode, detecting changes in the local potential relative to zero. The exploring electrode is defined relative to the three standard extremity leads, which are connected to form one indifferent reference electrode. Conventionally, the 6 Wilson leads are recorded from specific locations on the precordium (V1 to V6). The exploring electrodes of leads V1 to V3 are located to the right and are looking at the right side of the heart. The QRS complexes of the normal heart are mainly negative in these leads. The exploring electrodes of leads V4 to V6 are located to the left and are looking at the left side of the heart, where the QRS complexes are typically positive. Fig. 11-7: Standard limb leads (Einthoven’s triangle) and precordial ECG leads. In unipolar recordings, upright deflection indicates movement of the propagating wave towards the positive, exploring electrode, and downward deflection (a negative ECG wave) indicates that the propagation wave is moving away (Fig. 11-7). This paragraph deals with cardiac arrhythmias. Arrhythmia is any cardiac rhythm different from the normal sinus rhythm. Sinus rhythm is the automaticity elicited from the normal cardiac pacemaker, the sinus node. The sinus node depolarises spontaneously with a frequency between 60 and 100 beats per min (bpm) at rest. Normally the parasympathetic tone predominates, whereby the heart rate is reduced from 100 to 60-70 bpm at rest. Any reduction in parasympathetic tone or increase in sympathetic tone results in tachycardia (ie, a ventricular pumping frequency above 100 bpm). Reduction in sympathetic tone or increase of the parasympathetic tone leads to bradycardia (ie, a ventricular pumping rate below 60 bpm). Cardiac arrhythmias are divided into two groups: I. Pacemaker abnormalities, and II. Conduction abnormalities (cardiac block). arise in the sinus node (ie, sinus tachycardia, sinus bradycardia or sinus arrhythmia) or outside the node (ie, ectopic beats, tachycardia, and fibrillation and shifting pacemaker). These arrhythmias are disorders of rhythmogenesis. Sinus node disease is a mixture of conditions with insufficient discharge of signals from the sinus node. The sick sinus syndrome is caused by damage of the nodal tissue. Sinus pauses lead to sinus bradycardia, tachycardia, tachy-brady-cardia syndrome, ectopic beats or atrial arrest (sinus arrest). Sinus tachycardia (heart rate above 100 bpm) is caused by psychological (panic, anxiety) or physical stress (anaemia, hypoxia, exercise, fever, intoxication, shock etc). Any condition with increased sympathetic tone results in tachycardia. Adrenergic b-blockers are effective in slowing down the heart rate. Sinus bradycardia (heart rate below 60 bpm) is a normal phenomenon in well-trained people and in elderly persons. Athletes at rest have a high stroke volume and a low pulse, because they are dominated by vagal tone in this condition. All persons react with sinus bradycardia, during hypothermia, hypothyroidism, jaundice, increased intracranial pressure, treatment with digoxin or b-blockers, and in sinus node disease. Sinus arrhythmia is a normal phenomenon. There is a rise in heart rate during inspiration followed by a fall during expiration. During inspiration, the low intrathoracic pressure improves the venous return, which – with a delay through the pulmonary circulation - increases the stroke volume of the left ventricle. The resulting increase in aortic intravascular pressure combined with the low intrathoracic pressure around the aorta leads to an increased transmural pressure over the aortic wall and thus to a strong stimulation of the aortic baroreceptors. This is why the vagal tone falls and the sinus node discharge quickens. The reflex and circulation delay explains why the fall in heart rate manifests itself during expiration and not during inspiration. Ectopic beats originate in pacemaker cells outside the sinus node. The abnormal pacemaker tissue is triggered by ischaemia, mechanical or chemical stimuli. Cardiac catheterisation can trigger ectopic beats. Ectopic beats are either of atrial or ventricular origin. 1) Atrial ectopic beats appear as early (premature extrasystoles) and abnormal P-waves in the ECG; they are usually followed by normal QRS-complexes (Fig. 11-8). Following the premature beat there is often a compensatory interval. A premature beat in the left ventricle is weak because of inadequate venous return, but after the long compensatory interval, the post-extrasystolic contraction (following a long venous return period) is strong due the Starling´s law of the heart. - Adrenergic b-blockers are sometimes necessary. 2) Ventricular ectopic beats (extrasystoles) are recognized in the ECG by their wide QRS-complex (above 0.12 s), since they originate in the ventricular tissue and slowly spread throughout the two ventricles without passing the Purkinje system. The ventricular ectopic beat is recognized by a double R-wave (Fig. 11-8). The classical tradition of simultaneous cardiac auscultation and radial artery pulse palpation eases the diagnosis. Now and then a pulsation is not felt, and an early frustraneous beat is heard together with a prolonged interval. A beat initiated in the vulnerable period may release lethal ventricular tachycardia, since the tissue is no longer refractory. Fig. 11-8: Atrial (left) and ventricular (right) ectopic beats. After a period with high cardiac frequency from activity of an ectopic focus (ie, overdrive), there often follows a period with a remarkable fall in frequency (ie, overdrive suppression). During the overdrive, the Na+-K+-pump is extremely active in order to extrude Na+ from the myocardial cells in the short phase 4 periods, and the Na-influx exceeds the K-influx (Na:K= 3:2). Hereby, the cell becomes hyperpolarised in the end, which may stop the high frequency and turn it into suppression. Tachycardia occurs in paroxysms and is either of atrial or ventricular origin. 1) Atrial tachycardia is elicited in the atrial tissue outside the SN as an atrial frequency around 200 bpm. Often only every second impulse passes the AV-node to the ventricles, so a 2.1 AV-block is found in the ECG (Fig. 11-9). 2) Ventricular tachycardia is elicited from one focus in the ventricular tissue with a frequency around 200 bpm (more than 120 bpm) and abnormal intraventricular impulse conduction (disturbed QRS complexes). Of course, there are no P-waves in the ECG, and the QRS-complexes are broad and irregular (Fig. 11-9). Fig. 11-9: Left: Atrial tachycardia with a QRS-frequency of 100 bpm. - Right: Ventricular tachycardia with a QRS-frequency of 200 bpm following 2 sinus beats. Fibrillation is either atrial or ventricular in origin. 1) Atrial fibrillation is a condition in which the sinus node no longer controls the rhythm and the atrial muscle fibres undergo a tumultuous rapid twitching. A total irregularity of ventricular contractions characterise the fibrillation. An excitation wave with 400-600 cycles per min, courses continuously through the atrial wall over a circular pathway about the origin of the great veins (the circus motion theory). There is a continuous activation with more than 400 P-waves per min, where regular atrial contraction is impossible. It is difficult to see and count the P-waves of the ECG. Because of the refractoriness of the AV-bundle, only some of the excitation waves result in ventricular beats. The pulse of the patient is therefore irregular as the occurrence of QRS-complexes in the ECG. The many P-waves (also called f-waves for fluctuations) are characteristic for atrial fibrillation. Untreated atrial fibrillation has a QRS-frequency of 150-180 bpm (Fig. 11-10). Old patients with chronic heart disease often show the so-called slow atrial fibrillation with a QRS-frequency below 60 bpm. Most cardiac disorders can lead to atrial fibrillation or flutter. Atrial flutter is related to atrial fibrillation, but the atrial frequency - counted from the P-waves - is much lower than 400 bpm - usually around 300 bpm and the AV-conduction is more regular. The consequences to the patient depend upon the number of impulses conducted from the atria through the AV-node to the ventricles (recorded as QRS-complexes). Often every second impulse reaches the ventricles, so the ratio of AV-blocks is 2:1, but the ratio can also be 3:1, 4:1 etc. Atrial flutter is recognized in the ECG as sawtooth-like P-waves (Fig. 11- 10). 2) Ventricular fibrillation is a tumultuous twitching of ventricular muscle fibres, which are ineffectual in expelling blood. The condition is lethal without effective resuscitation. The irregular ventricular rate is 200-600 twitches/min. Without contractile co-ordination the force is used frustraneous. Actually, the heart does not pump blood, so within 5 s unconsciousness occurs, because of lack of blood to the brain. In patients with coronary artery disease, ventricular fibrillation is a cause of sudden death. The trigger is anoxia (with an ineffective Na+-K+-pump) and the impulses arise from several foci in the ventricular tissue. There is no regular pattern in the ECG. Ventricular fibrillation is initiated when a premature signal arrives during the downslope of the T-wave (vulnerable period). Electrical shock (electrocution) also triggers ventricular fibrillation. Fig. 11-10: Ventricular defibrillation of a patient with cardiac arrest. Ventricular fibrillation is the most serious cardiac arrhythmia. It must be converted to sinus rhythm at once by the application of a large electrical shock to the heart (ventricular defibrillation) or the patient will die. Alternating current is applied for 100 ms or 1000 volts direct current is applied for a few milliseconds. The vulnerable period (VP in Fig. 11-7 is actually phase 3 and represented in the ECG as the T-wave) is dangerous, because an electrical shock, when given during this period, will cause in itself ventricular fibrillation. Here is shown sinus rhythm and one ectopic beat followed by ventricular fibrillation. The only effective treatment is rapid institution of electrical defibrillation.Fig. 11-11: Left: Atrial fibrillation with a QRS-frequency of 180 bpm. - Right: Ventricular fibrillation following 2 beats of sinus rhythm and one ectopic beat. Shifting pacemaker is a condition where the impulse originates in shifting locations inside the SN, or the pacemaker shifts from the SN to the AV-node. In the first case the P-wave change size from beat to beat, and in the second case the P-wave is found either in front of the QRS-complex or behind.are 1) sino-atrial block, 2) atrioventricular block, 3) bundle branch block, 4) WPW- syndrome, and 5) the long QT-syndrome. 1) Sino-atrial block (see SN disease) is characterized by long intervals between consecutive P-waves, and caused by blockage of the formation or conduction of the stimulus from the SN to the atrial tissue (ischaemia or infarction of the SN).2) Atrioventricular block is blockage of the conduction from the atria to the AV-node. The first-degree AV block is a prolongation of the PQ (PR)-interval (above 0.2 s) implying a delay of the conduction - not a real block. All beats are conducted, so there is a QRS-complex following each P-wave, although with delay (Fig. 11-12).The second-degree AV block occurs when some signals are not conducted to the AV-node, so some of the P-waves are not followed by QRS-complexes. The ventricles actually drop some beats. A typical example is Mobitz type I block or Wenchebach block, which is a predictive loss of a QRS-complex. The PQ-interval is increased progressively until a P-wave is not followed by a QRS-complex. Mobitz type II block occurs without warning. Suddenly, a QRS- complex falls out (Fig. 11-12). The third degree AV block (complete AV-block) is a total block of the conduction between the SN and the ventricles. Also blocked Hiss bundle conduction results in an AV-block (Fig. 11-12). An AV- or ventricular pacemaker maintains life with a spontaneous escape rhythm around 40-50 bpm, or cardiac arrest occurs with the fainting paroxysms of Adam-Stokes syndrome. The Adam-Stokes syndrome is a clinical disorder caused by a partial AV-block, with a long P-Q interval and a wide QRS complex in the ECG, suddenly becoming a total bundle block. The condition results in unconsciousness and cramps caused by brain hypoxia and sometimes resulting in universal cramps (grand mal) due to violent activity in the motor cortex. The keyhole is the AV node and the bundle of His. Disease processes here elicit the Adam-Stokes syndrome. Therapy is to provoke sinus rhythm by a few forceful strokes in the precardial area of the thorax, accompanied by mouth-to-nose-resuscitation and external heart massage. A sympathomimetic drug can be injected if necessary even in the heart directly. The patient must be immediately brought to hospital for special intensive care. Permanent pacemaker treatment may become necessary. Fig. 11-12: Four types of atrio-ventricular (AV)-block. From above downwards: First-degree AV-block, Second-degree Mobitz I block (Wenchebach), Second-degree Mobitz II block, and Complete AV-block. 3) Bundle branch block is a block of the right or the left bundle branches. The signal is conducted first through the healthy branch and then it is distributed to the damaged side. This distribution takes more time than usual, so the QRS-complex is wider than normal (more than 0.12 s in Fig. 11-13). In right bundle branch block, the right ventricle is activated late, which is shown by a tall double R-wave in V1 (ie, the second late R-wave is from the right side), and a deep wide S-wave in leads I and V6 . The left bundle branch block is characterized by a late activation of the left ventricle from apex towards basis. This results in a solid R-wave in the left precardial leads (V5 andV6), whereas there is a deep broad S-wave in V1 and III (Fig. 11-13). Fig. 11-13: Right and left bundle branch block. 4) WPW-syndrome or Wolf-Parkinson-White block is not a direct block of the conduction through the Hiss bundle and branches, but is caused by a short cut through an extra conduction pathway from the atria to the ventricles. This abnormal conduction pathway is congenital and called the bundle of Kent (Fig. 11-14). Due to this short-cut, the slow conduction through the AV-node is bypassed and the ventricles are depolarised faster than normal. The WPW-syndrome is recognized in most ECG leads as a short PQ (PR)-interval followed by a wide QRS-complex with a delta wave (Fig. 11-14 ). The patients often have paroxysmal tachycardia or they may develop atrial fibrillation. Some patients are treated with ablation of the bundle of Kent. Other patients are asymptomatic and in good physical condition. Fig. 11-14: The WPW-syndrome and the long QT-syndrome. 5) The long QT-syndrome. This is frequently a genetic condition, where fast repolarised cells are restimulated by cells that have not repolarised. When acquired the condition is caused by myocardial ischaemia, by drugs or by a low serum [Ca2+] - below 2 mM. Normally, the QT-interval is less than 50% of the preceding RR-interval (Fig. 11-14). The long QT-interval symbolises a long ventricular systole. Actually, the ST-interval is simultaneous with the phase 2 plateau of the ventricular membrane action potential. Here, the slow Ca2+ -Na+ - channels remain open for more than 300 ms as normally. The net influx of Ca2+ and Na+ is almost balanced by a net outflux of K+. Hereby, a long phase 2 plateau or isoelectric segment is formed. Implanted cardiac pacemakers are successful in keeping heart patients alive. This is often a beneficial treatment of Adam Stokes syndrome or ventricular tachycardia. An electrical pacemaker is a small stimulator with battery planted underneath the skin. The electrodes are connected to the right ventricular muscle tissue, whose contraction rate is controlled by the stimulator. Cardiac arrest is cessation of all spontaneous cardiac rhythmicity. Cardiac arrest is most often caused by anoxia. The cause of anoxia is inadequate respiration due to terminal lung disease, thoracic trauma, and shock or deep anaesthesia. Cardiopulmonary resuscitation is important in keeping the heart alive until electrical defibrillation can be performed with a large electrical shock. Alternating current is applied for 100 ms, or 1000 mV direct current is applied for a few ms. The consequences of the rise in cardiac mass are the same for the locally recorded ventricular fibre action potentials. The action potentials increase in magnitude, with a parallel increase of QRS voltage observed in the ECG. The heart partially adapts to the increase in workload by an increase in muscle mass (hypertrophy). The degree of hypertrophy is roughly proportional to the increase in load. As the electrically active surface area is increased, there is an increase in ventricular fibre action potential, and thus in the amplitude of the R wave in the left precordial leads. The ECG criterion of left ventricular hypertrophy is that the sum amplitude of S in V1 and R in V6 is larger than 3.5 mV (3.5 cm). With a delay in conduction through the large left ventricle - or with left bundle branch block - there is a wide QRS complex. The normal positive T-wave is due to the apical directed repolarization of the ventricular AP. Therefore, asymmetrical T-inversion or bi-phasic T-waves and downward-sloping ST-segment signal abnormal repolarization with the propagating wave moving away from the apical electrode in most leads (so-called strain pattern in Fig. 11-15). Left axis deviation is often found in the standard leads of left ventricular hypertrophy patients (augmented R-wave in I and S-wave in III). Fig. 11-15: ECG from a patient with left ventricular hypertrophy. The disorders causing left ventricular hypertrophy are: Heart diseases: Myocardial disorders, pericarditis, valvular disorders, congenital heart disease. Vascular disorders: Atherosclerosis, systemic hypertension (Chapter 12) , aortic stenosis, renal disorders, arteriovenous shunts, and aneurysms. Thoracic diseases: Diseases of the lungs & pleura, and kyphoscoliosis. Pumping of increased volume load: Acromegaly, anaemia, obesity and excessive alcohol intake, thyrotoxicosis, severe manual work and sports. Left ventricular hypertrophy is often demonstrated by echocardiography or found on the ECG. I. Each of the following five statements have True/False options: Stem statement: The ventricular action potential is A. initiated by rapid entry of Na+. B. characterised by slow Ca2+ -Na+- channels. C. characterised by closed K+- channels in phase 3. D. dependent upon Ca2+-influx. E. independent of the Na+-K+ -pump in phase 4. II. Each of the following five statements have True/False options: A. In myocardial cells, as in nerve and skeletal muscle cells, K+ plays a minor role in determining the resting membrane potential. B. The impulse propagates from the sinus node via five bundles of internodal syncytial cells through the left and right atrial wall to the atrioventricular node. C. The long absolute refractory period of the ventricular cells, covers the whole shortening phase of the contraction, where all the fast Na+-channels are voltage-inactivated. As a consequence, no stimulus is sufficient regardless of size. D. The fast Na+-influx causes phase 0 of atrial- , ventricular- , and Purkinje- action potentials. The fast Na+-channels are both voltage- and time-dependent. E. Noradrenaline activates a-adrenergic constrictor receptors in the coronary vessels, whereas adrenaline activates b-adrenergic vasodilatator receptors. III. The following five statements have True/False options. A. WPW-syndrome or Wolf-Parkinson-White block is caused by a short cut through an extra conduction pathway from the atria to the ventricles. B. Atrial fibrillation is more malignant than ventricular fibrillation. C. All pacemaker abnormalities arise in the sinus node. D. Premature beats are also called atrial ectopic beats. E. Only few cardiac arrhythmias can lead to atrial fibrillation and flutter. Try to solve the problems before looking up the answers. · The heart rate is controlled mainly by the autonomic nervous system. Sympathetic stimulation speeds up the sinus node (sinus tachycardia) and vagal activity slows the node (sinus bradycardia). · The autonomic nervous system controls myocardial contraction by varying the Ca2+ -permeability of the sarcolemma via hormones and the adenylcyclase system. · Increased concentration of the sympathetic transmitter noradrenaline, and of adrenaline from the adrenal glands, cause increased contractility, increased frequency, increased conduction velocity, and increased irritability of the heart. · Catecholamines and increasing extracellular [Ca2+], raise the cytoplasmic [Ca2+] and thus the developed force of contraction. · Cardiac digitalis glycosides (digoxin) block the Na+-K+-pump. This blockage increases the internal [Na+] to the extent that less Ca2+ is removed from the cell. This - and any - form of elevated cytoplasmic [Ca2+] enhances contractile force. Increased [K+] in the extracellular fluid reduces the force of contraction, so the heart becomes dilatated and flaccid. · Noradrenaline activates a-adrenergic constrictor receptors in the coronary vessels, whereas adrenaline activates b-adrenergic vasodilatator receptors. · The neurotransmitter acetylcholine, activating muscarinic receptors, and vagal stimulation cause reduced contractility (negative inotropic state), reduced frequency (negative chronotropic state), reduced conduction velocity (negative dromotropic state), and reduced irritability (negative bathmotropic state). · Changes in blood concentrations of gasses and protons affect the cardiac function directly and indirectly via chemoreceptors. · The long absolute refractory period of the ventricular cells, covers the whole shortening phase of the contraction, where all the fast Na+-channels are voltage-inactivated. As a consequence, no stimulus is sufficient regardless of size. · The electrocardiogram (ECG) is a surface recording of the electrical field generated in the entire body by the heart. · The sinus node is a minimal muscle mass, and there is no potential difference (wave in the ECG) before the atria depolarise with a P-wave. When the propagating wave is directed towards the electrode (as in lead II) the atrial depolarization will produce a positive P-wave. · The P-waves correspond to the impulse distribution in the atria, and the QRS-complex origin from depolarisation of the strong ventricular myocardium. · The QRS deflections in two of the three standard leads can be drawn graphically in a triangle and their resultant is the mean QRS-axis of the heart. · The T-wave is caused by the spread of repolarization over the ventricles. · The small propagating wave moving away from the electrode at the apex and to the right to reach the right ventricle, is responsible for the small, negative S-wave. · The Adam-Stokes syndrome is a clinical disorder caused by a partial AV-block, with a long P-Q interval and a wide QRS complex in the ECG, suddenly becoming a total bundle block. The condition results in unconsciousness and cramps caused by brain hypoxia and sometimes resulting in universal cramps (grand mal) due to violent activity in the motor cortex. Disease processes in the AV node and the bundle of His elicit the Adam-Stokes syndrome. · Ventricular tachycardia is defined as three or more ventricular beats occurring at a rate of 120 beats per min or more. · Ventricular fibrillation is an extremely rapid ventricular activation without pumping effect. Electrical defibrillation is the only effective therapy. · Vulnerable period is a dangerous period in cardiac cycle represented in the ECG as the downslope of the T-wave. Electrical conversion (an electrical shock) given during this period causes in itself ventricular fibrillation. Cardiovascular Reviews & Reports. Monthly journal published by Le Jacq Communications Inc, 777 West Putnam Av., Greenwich CT, 06830, USA. Kastor, JA (2000) Arrhythmias. 2nd Ed. Philadelphia: W.B.Saunders Co. Surawicz, B (1995) Electrophysiological Basis of ECG and Cardiac Arrhythmias. Baltimore: Williams and Wilkins. |
||
Click here to introduce your comments or contributions
